


To receive Ilya's analysis directly via email, please SIGN UP HERE
Talking Points:
- GBP/USD Technical Strategy: Flat
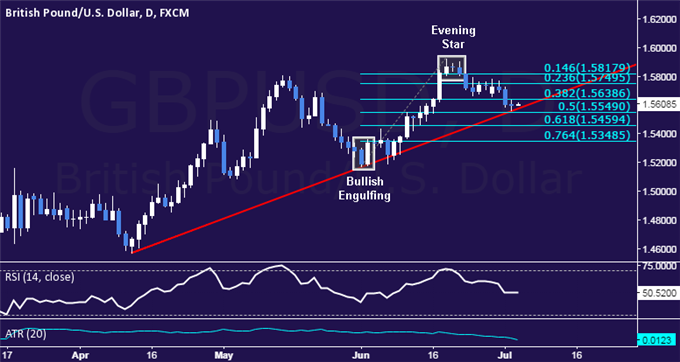
- Support: 1.5549, 1.5459, 1.5349
- Resistance: 1.5639, 1.5750, 1.5818
The British Pound turned lower against the US Dollar as expected after putting in a bearish Evening Star candlestick pattern. A daily close below the1.5549-74 area (50% Fibonacci retracement, trend line) exposes the 61.8% level at 1.5460. Alternatively, a turn above the 38.2% Fib at 1.5639 opens the door for a challenge of the 23.6% retracement at 1.5750.
Prices are too close to support to justify entering short from a risk/reward perspective. On the other hand, the absence of a defined bullish reversal signal suggests that taking up the long side is premature. With that in mind, we will remain flat for now.
Add these technical levels directly to your charts with our Support/Resistance Wizard app!
--- Written by Ilya Spivak, Currency Strategist for DailyFX.com


