


To receive Ilya's analysis directly via email, please SIGN UP HERE
Talking Points:
- USD/JPY Strategy: Flat
- Candlestick Pattern Still Warns of Topping
- Range Top Below 121.00 in Focus Again
The US Dollar is tread water against the Japanese Yen but a bearish Dark Cloud Cover candle pattern continues to warn of a top in place. A break below range support at 117.43 exposes the December low at 115.55, followed by the 38.2% Fibonacci retracement at 113.78. Alternatively, a move above the 23.6% Fib expansion at 120.53 targets the 38.2% threshold at 123.61.
The dominant long-term USD/JPY trend looks to be favoring the upside. As such, we will treat any on-coming losses as an opportunity to enter long at more compelling levels once the correction is exhausted.
Add these technical levels directly to your charts with our Support/Resistance Wizard app!
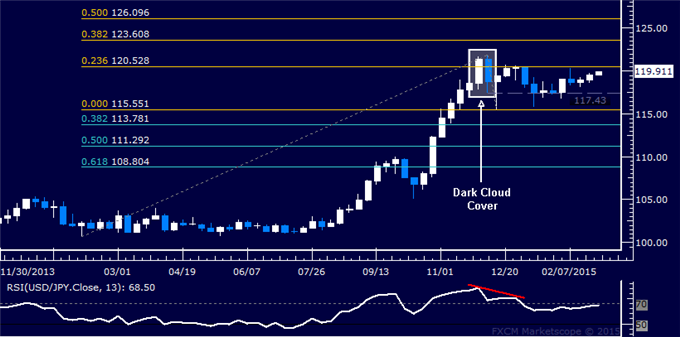
Weekly Chart - Created Using FXCM Marketscope
--- Written by Ilya Spivak, Currency Strategist for DailyFX.com


