Skip to Content
News & Analysis at your fingertips.

We use a range of cookies to give you the best possible browsing experience. By continuing to use this website, you agree to our use of cookies.
You can learn more about our cookie policy here, or by following the link at the bottom of any page on our site. See our updated Privacy Policy here.

Free Trading Guides
Subscribe
Please try again
Select

Live Webinar Events

0

Economic Calendar Events

0

Notify me about

Live Webinar Events
Economic Calendar Events

H

High

M

Medium

L

Low
More View More
GBP/USD Candlestick Analysis: Rebound Begins as Expected

GBP/USD Candlestick Analysis: Rebound Begins as Expected

To receive Ilya's analysis directly via email, please SIGN UP HERE

Talking Points:

  • GBP/USD Strategy: Flat
  • Pound Begins Recovery as Expected
  • Waiting to Sell Once Bounce Fizzles

The British Pound turned higher against the US Dollar as expected after prices put in a Bullish Engulfing candlestick pattern coupled with positive RSI divergence. From here, a push above the 23.6% Fibonacci retracement at 1.5185 exposes the 38.2% level at 1.5568. Alternatively, a reversal back below the 14.6% retracement at 1.4948 targets the 23.6% Fib expansion at 1.4561.

The overall GBP/USD trend continues to look bearish. With that in mind, we will treat any further gains as corrective and look to them as an opportunity to establish a short position at more attractive levels once the upswing is exhausted.

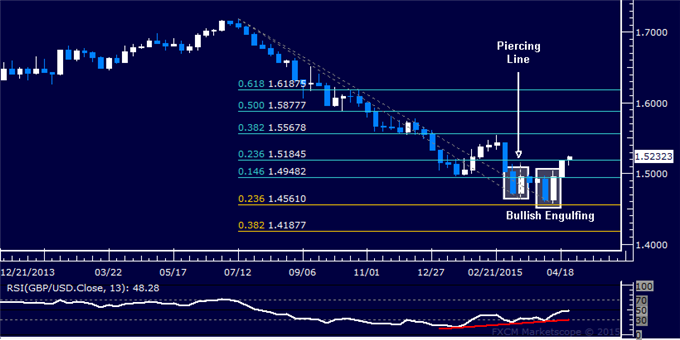
Weekly Chart - Created Using FXCM Marketscope

--- Written by Ilya Spivak, Currency Strategist for DailyFX.com

DailyFX provides forex news and technical analysis on the trends that influence the global currency markets.

DISCLOSURES