


The theme remains a bearish one in the cryptocurrency space despite the relentless selling pressure we’ve seen so far this year. They don’t appear oversold yet. Bitcoin and Ripple are both posting triangle patterns within the context of the downward slide, increasing the likelihood we see more selling just ahead. Ethereum is hanging out towards the high end of a maturing range, making it a point of interest for shorts from a risk/reward perspective.
See how positioning changes in cryptocurrencies and other markets can help as a tool to determine price direction on the IG Client Sentiment page.
Bitcoin & Ripple forming triangles
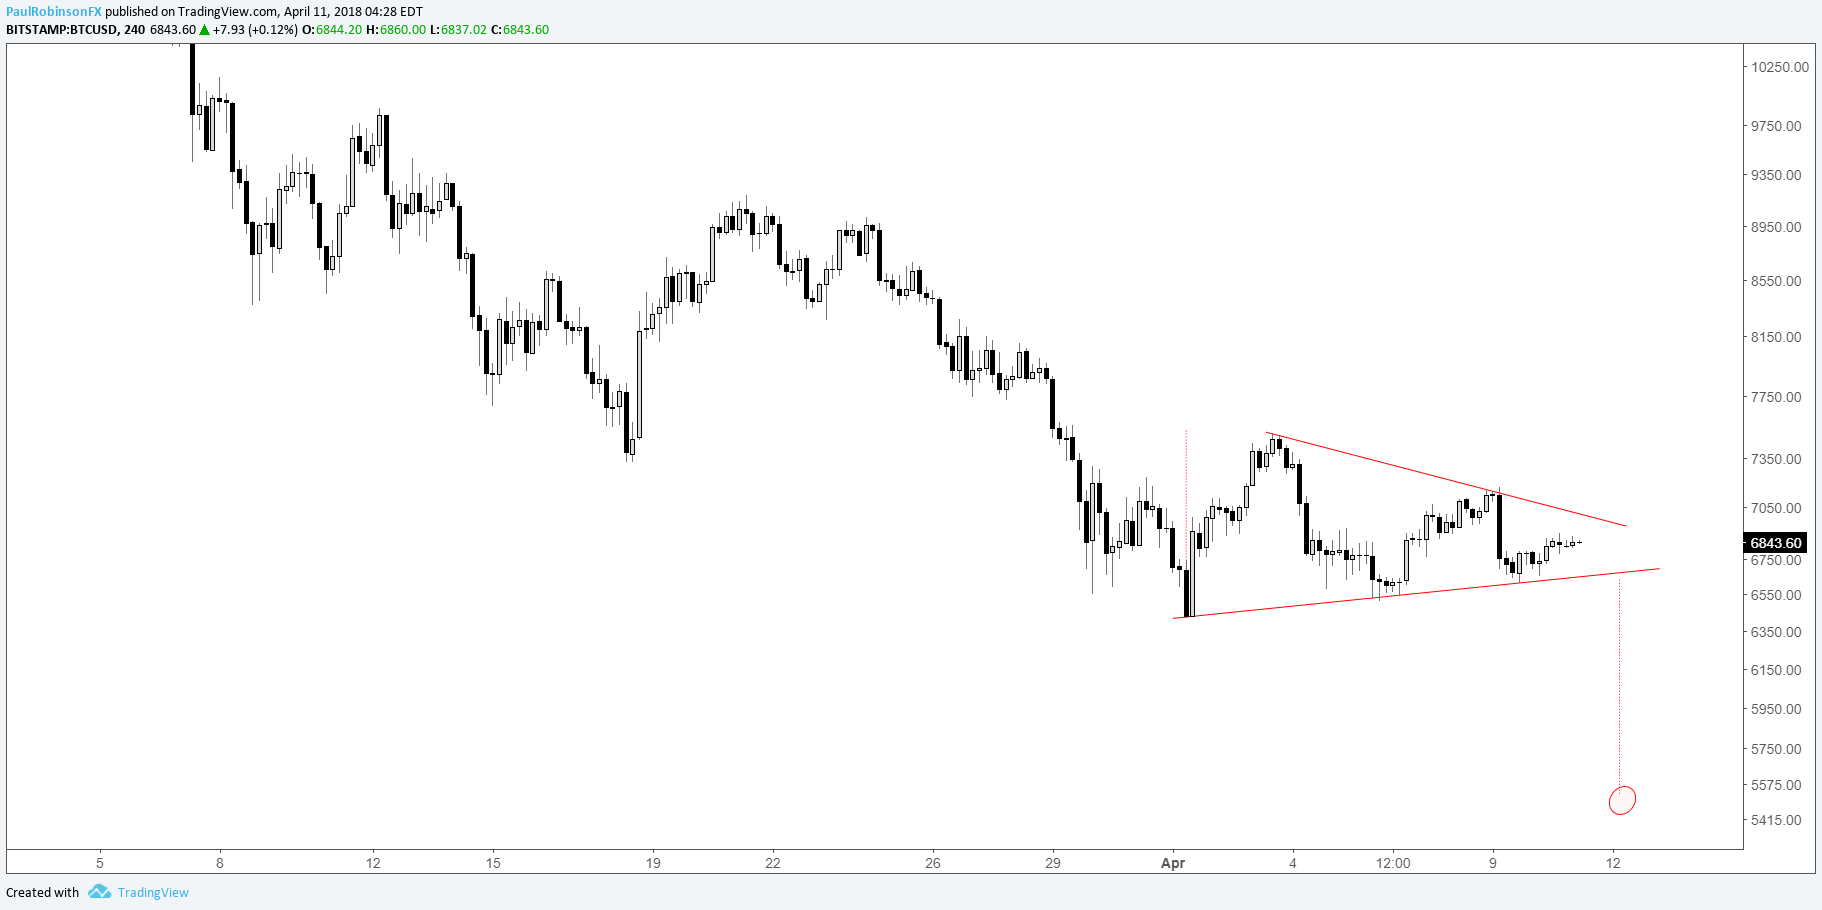
Short-term price swings in Bitcoin and Ripple have been growing increasingly smaller, and as a result symmetrical triangles are building on the 4-hr time-frame. The nature of these triangles is as such – they don’t in of themselves forecast which direction the market is about to head, just that contraction in volatility is nearing its end.
However, when a solid trend is in place – in this case lower – the likelihood of a downside break is elevated. If indeed we see a break along the path of least resistance often times it leads to a smoother trade than if they break out against the primary trend.
The key is waiting for the break, because there is still risk of an upside breakout – waiting for confirmation is prudent. A 4-hr closing bar below the lower trend-line will be our cue to look for lower prices. Trade through the top-side will have a rally in focus, but could be a more difficult proposition given how weak the trend has been. Risk of a failed breakout will be elevated.
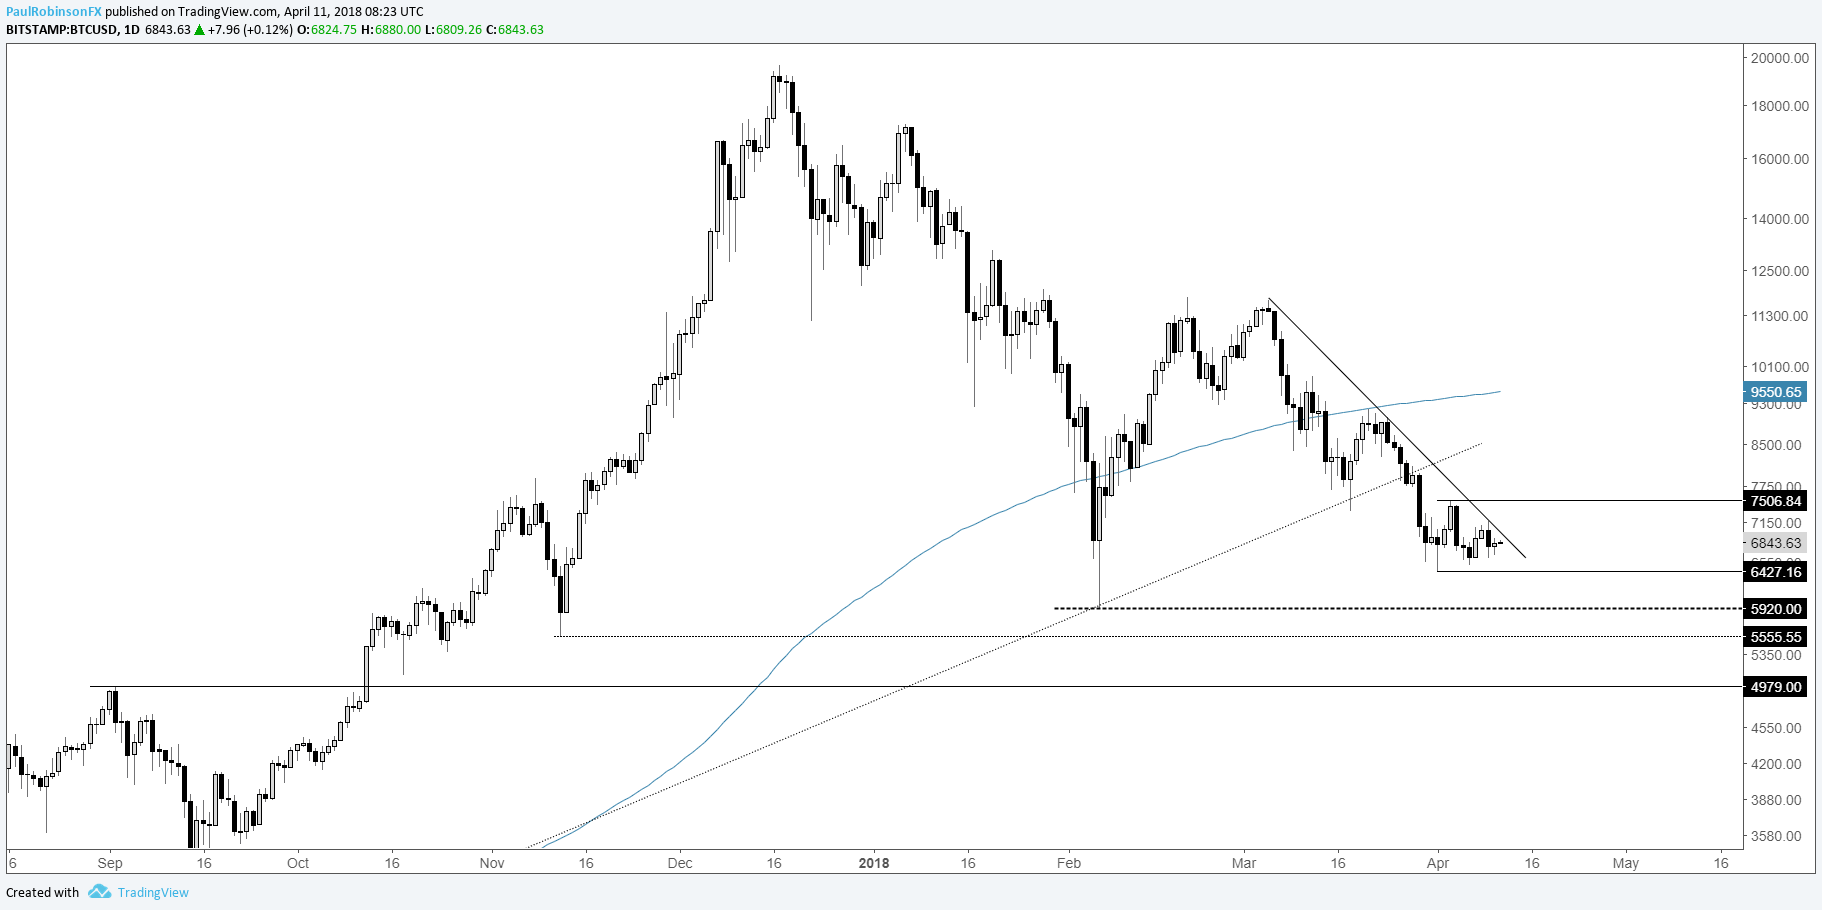
In the event of a breakdown, the height of the triangle in Bitcoin(BTC/USD) implies a measured move target of ~5500, but before it can reach that point it will need to take out the February spike-low at 5920. It will be important to watch for a reaction should it trade down to that level.
Check out this guide to learn more about how to trade Bitcoin and other cryptocurrencies.
BTC/USD 4-hr Chart (triangle)
BTC/USD Daily Chart (w/Price levels)
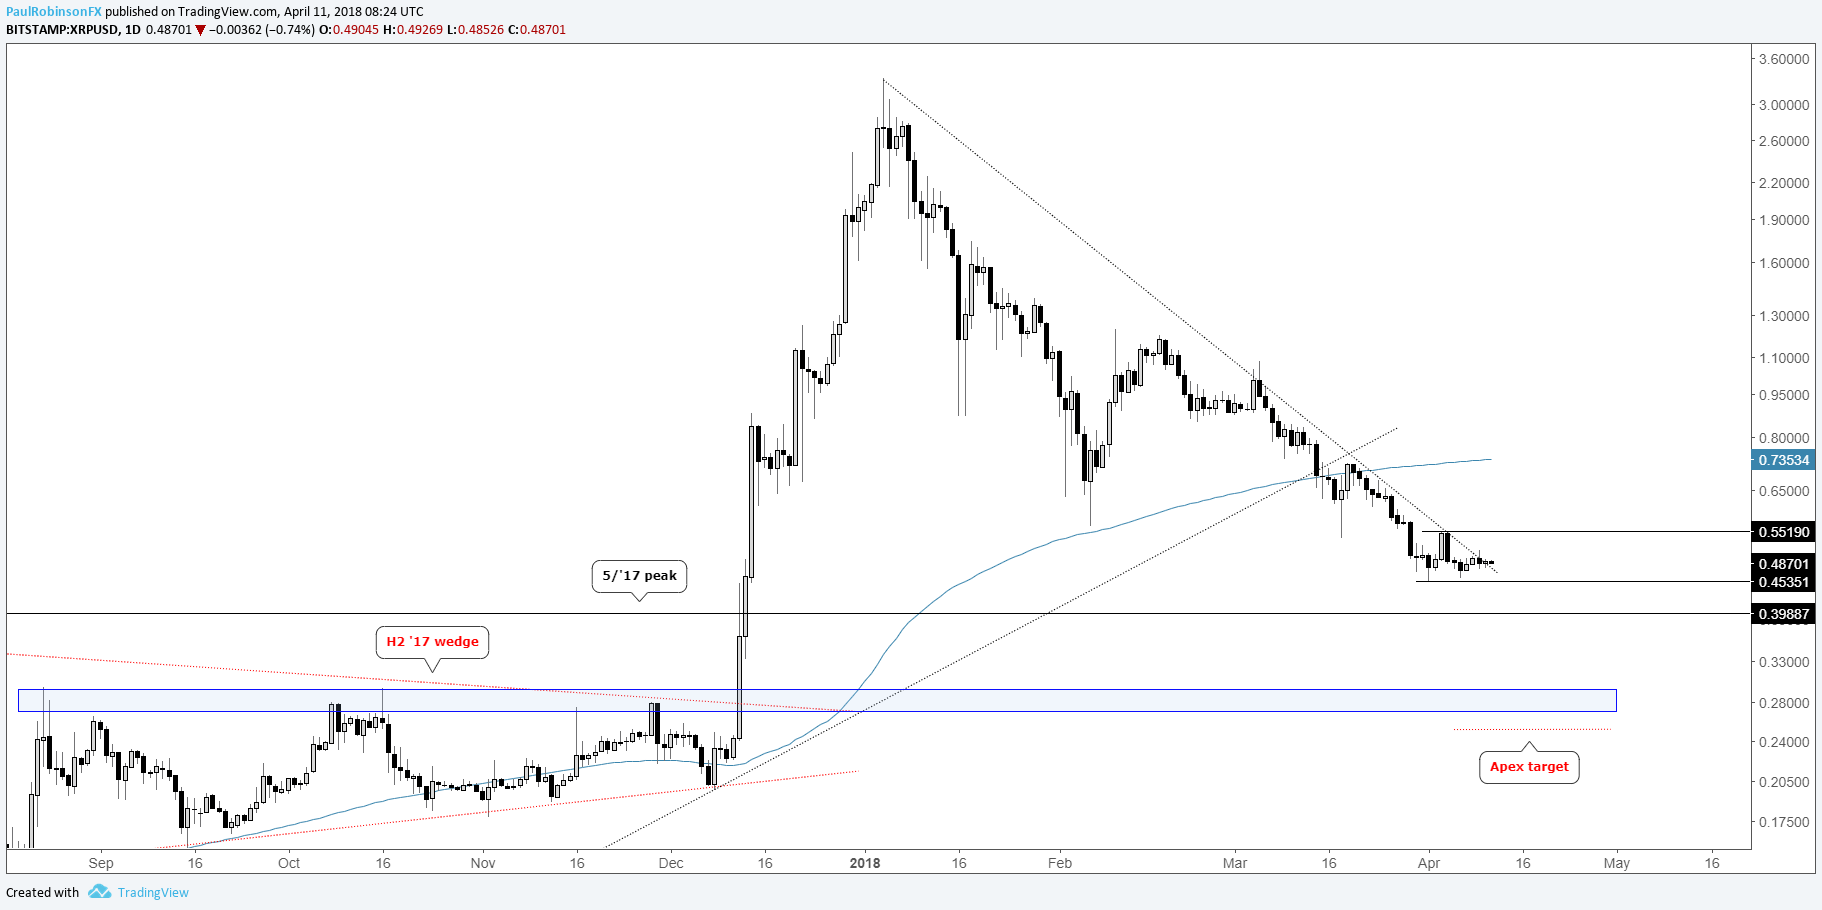
The height of the triangle in Ripple(XRP/USD) implies a measured move target of around 37 cents. But, remember, we need to wait for a breakdown, first. The May 2017 peak just under 40 cents stands in the way of this target, so keep an eye on how price behaves around this level. The broader target remains the apex of the wedge which Ripple broke out of late last year. This lies down around 25 cents.
XRP/USD 4-hr Chart (triangle)

XRP/USD Daily Chart (w/Price Levels)
Ethereum trading at top of short-term range
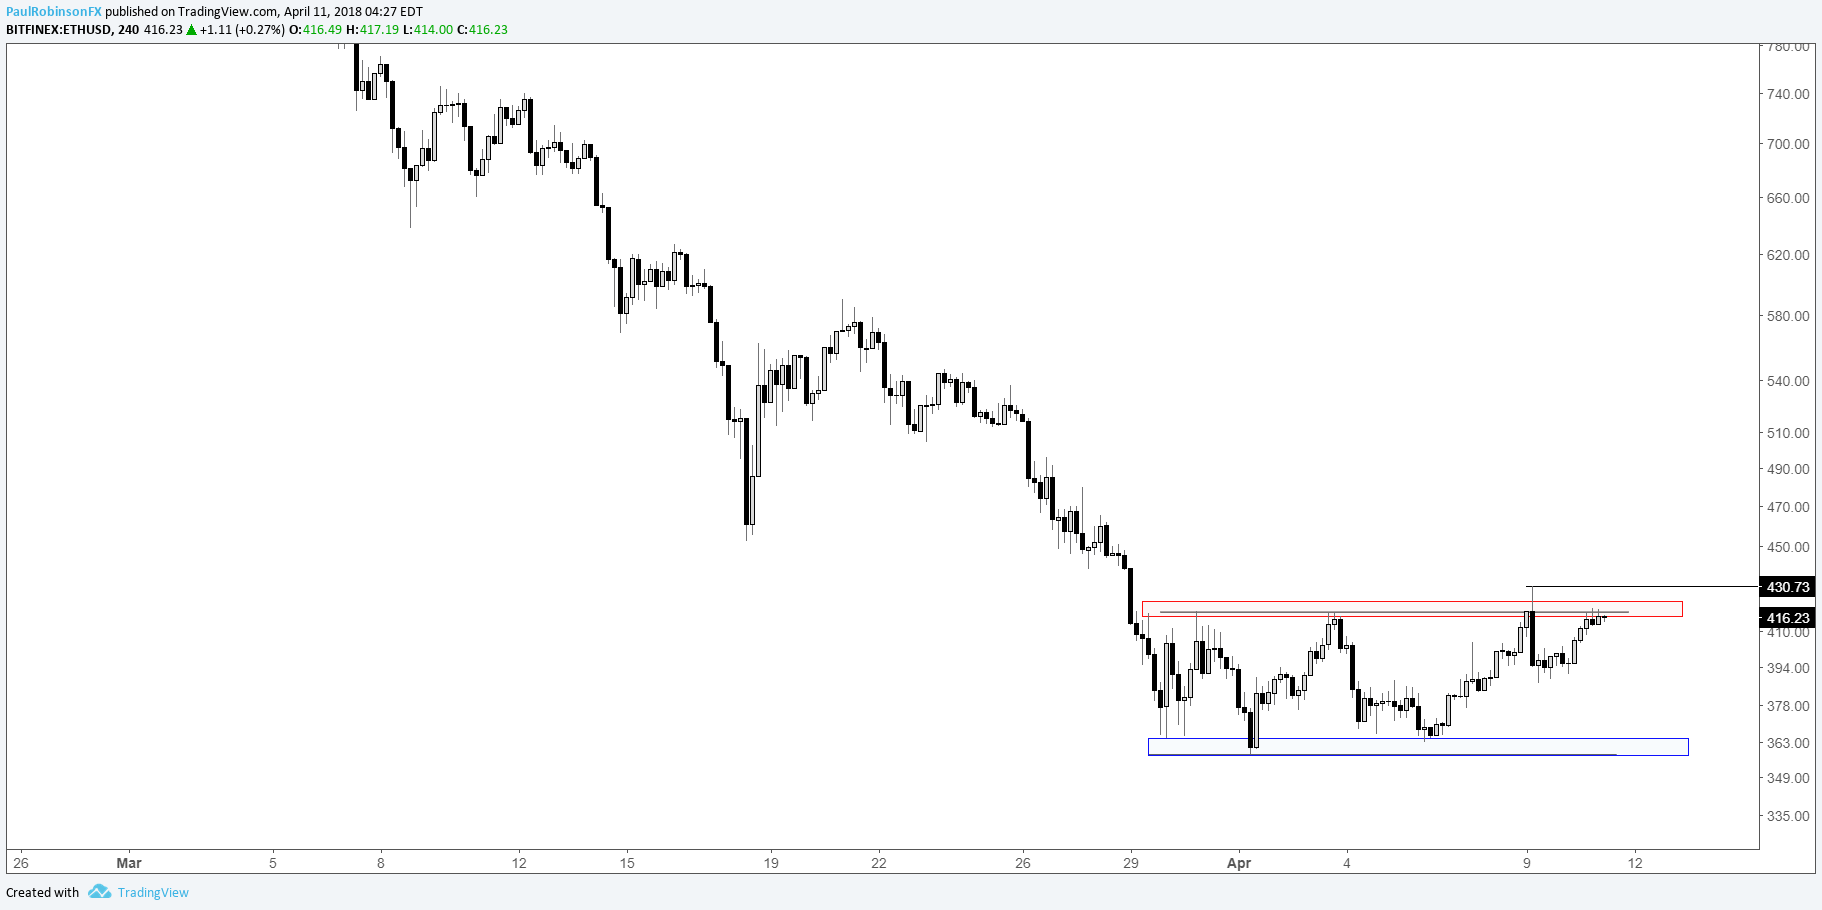
Ethereum (ETH/USD) is set up a bit differently than the prior two, with a range or channel developing. It’s currently pressing up against the upper bounds, providing an attractive spot for would-be sellers to establish a position in the direction of the primary trend.
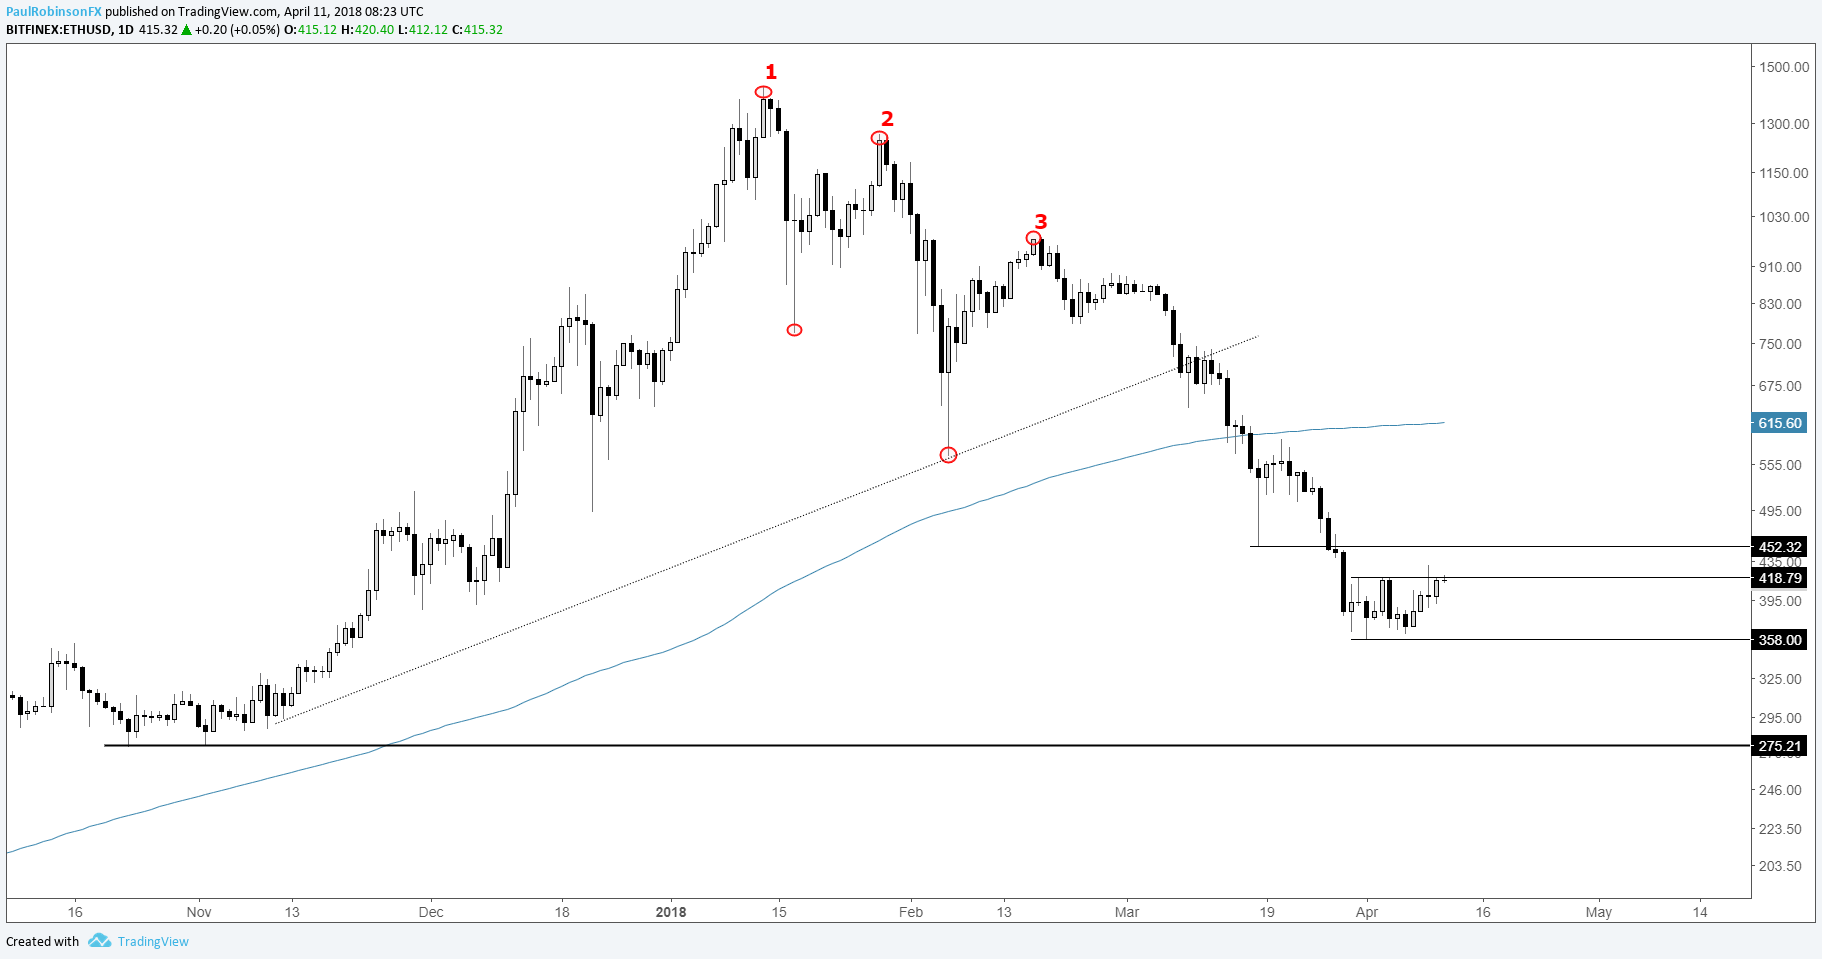
A breakout above 431 would be reason for caution, while a breakdown through the bottom of the range could bring 275 into play. The 1,2,3 top on the daily time-frame has more than exceeded expectations so far (was targeting 400), but more downside looks to be on the way in this sequence before a tradable low develops.
ETH/USD 4-hr Chart (At top of range)
ETH/USD Daily Chart
Helpful Resources for Cryptocurrency Traders
Whether you’re a new or experienced cryptocurrency trader, we have several resources to help you;Introduction to bitcoin trading guide, indicator for tracking trader sentiment, and a weekly webinar discussing the latest developments.
---Written by Paul Robinson, Market Analyst
To receive Paul’s analysis directly via email, please SIGN UP HERE
You can follow Paul on Twitter at @PaulRobinsonFX


