


The cryptocurrency space continues to trade heavy, with Ethereum and Ripple again making a run at breaking notable support levels. Given the importance of these levels selling could become aggressive on a confirmed break. To start the week, Bitcoin tested an important area of resistance and once again found sellers. A broad move lower in the sector could be in store in the days ahead.
To see how traders are positioned in Cryptocurrencies and other markets, check out the IG Client Sentiment page.
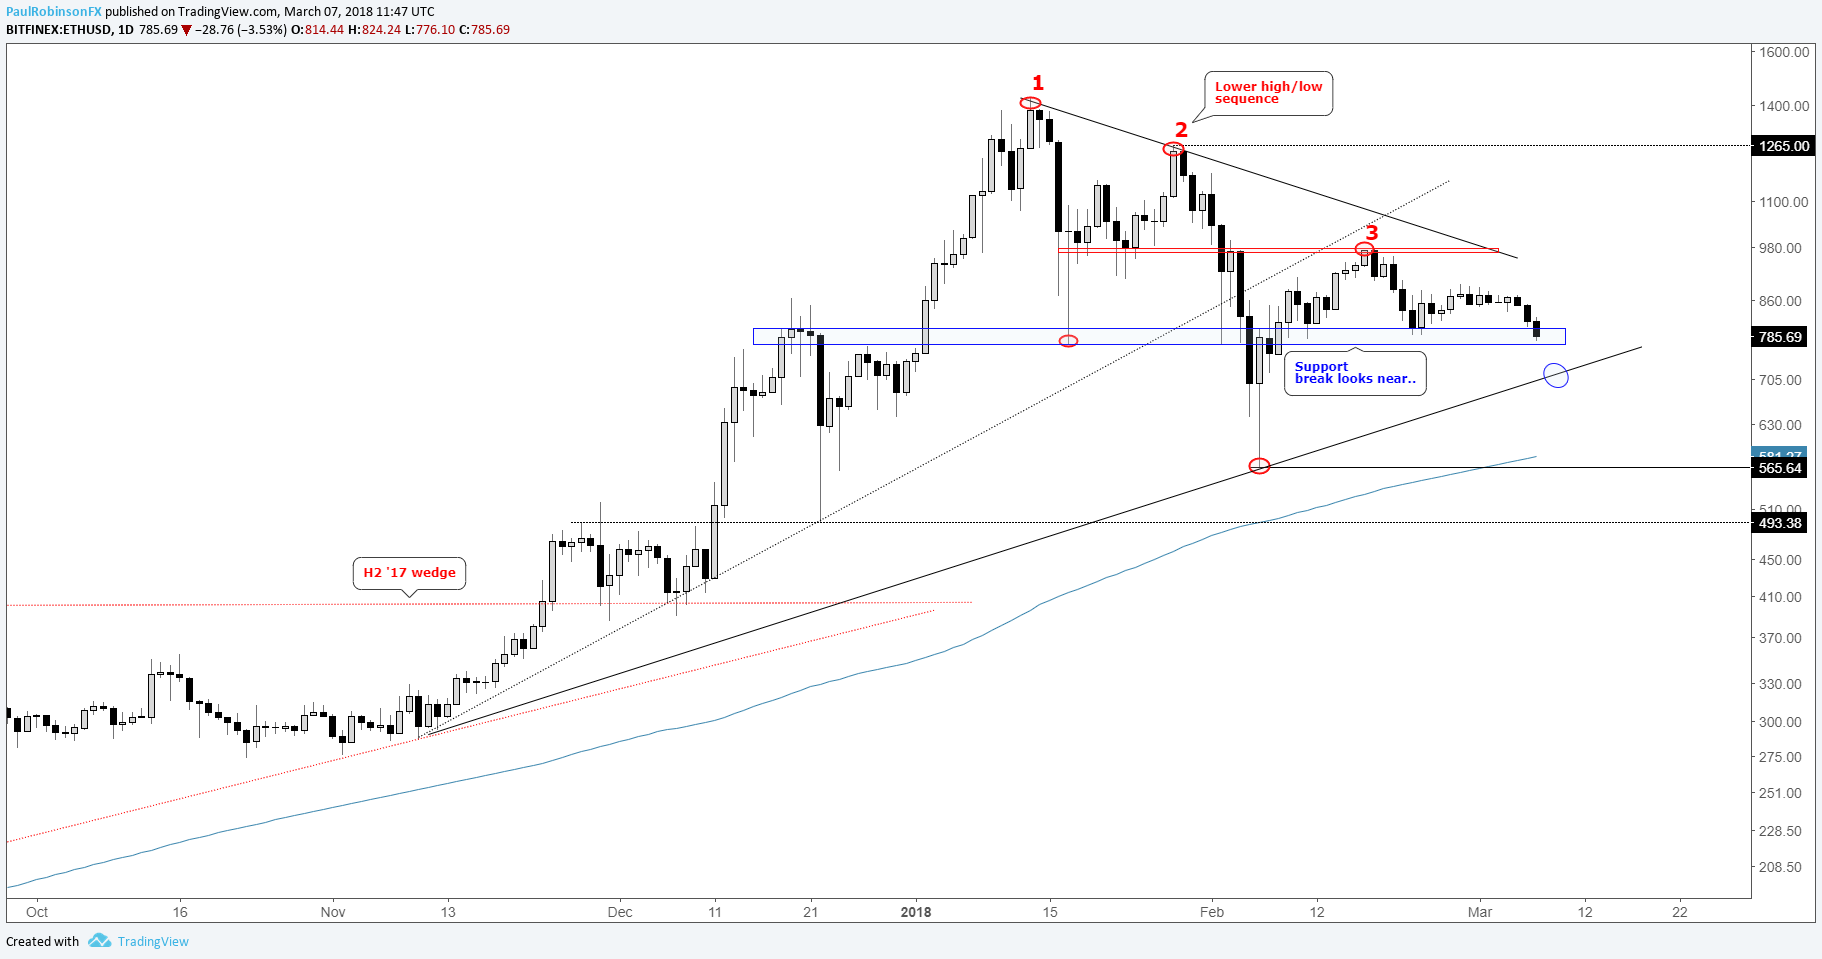
Ethereum on the verge of a breakdown below 770
Last week, we highlighted the development of a ‘head-and-shoulders’ pattern on the 4-hr time-frame in Ethereum, and while the right side of the pattern become elongated, the notable support zone in the vicinity of 800/770 was viewed as the most important technical signpost to watch.
A daily close below 770 could quickly further along the topping formation in progress since January. There is support not far below by way of the November trend-line, but it may not hold much weight given the bigger support break and exerting pressure of the broader topping pattern.
A break below the November trend-line will bring into focus the 200-day and Feb low at 565, both currently in near proximity to one another. It’s not likley that it will happen in one fell swoop, but the eventual target remains near 400, the apex of the wedge from the second-half of last year.
Want to learn more about cryptocurrencies? Check out this guide, Introduction to Bitcoin Trading
ETH/USD Daily Chart (support under fire)
Support in Ripple under fire again following short-lived bounce
For about two weeks Ripple sat on support surrounding 87-cents, giving reason to believe it would give-way to sellers without a bounce. However, we saw a quick flip higher on 3/4, but XRP/USD was quickly swatted lower, bringing big support back into play again.
The jab higher and return to support further increases the risk we will soon see a breakdown. If this turns out to be the case, then the 200-day around 66-cents and January 2017 trend-line (in confluence with one another) will be targeted. Like Ethereum, the larger target is the apex of the wedge formed during last year, which doesn’t arrive until all the way down around 25-cents.
XRP/USD Daily Chart (support looks fragile)

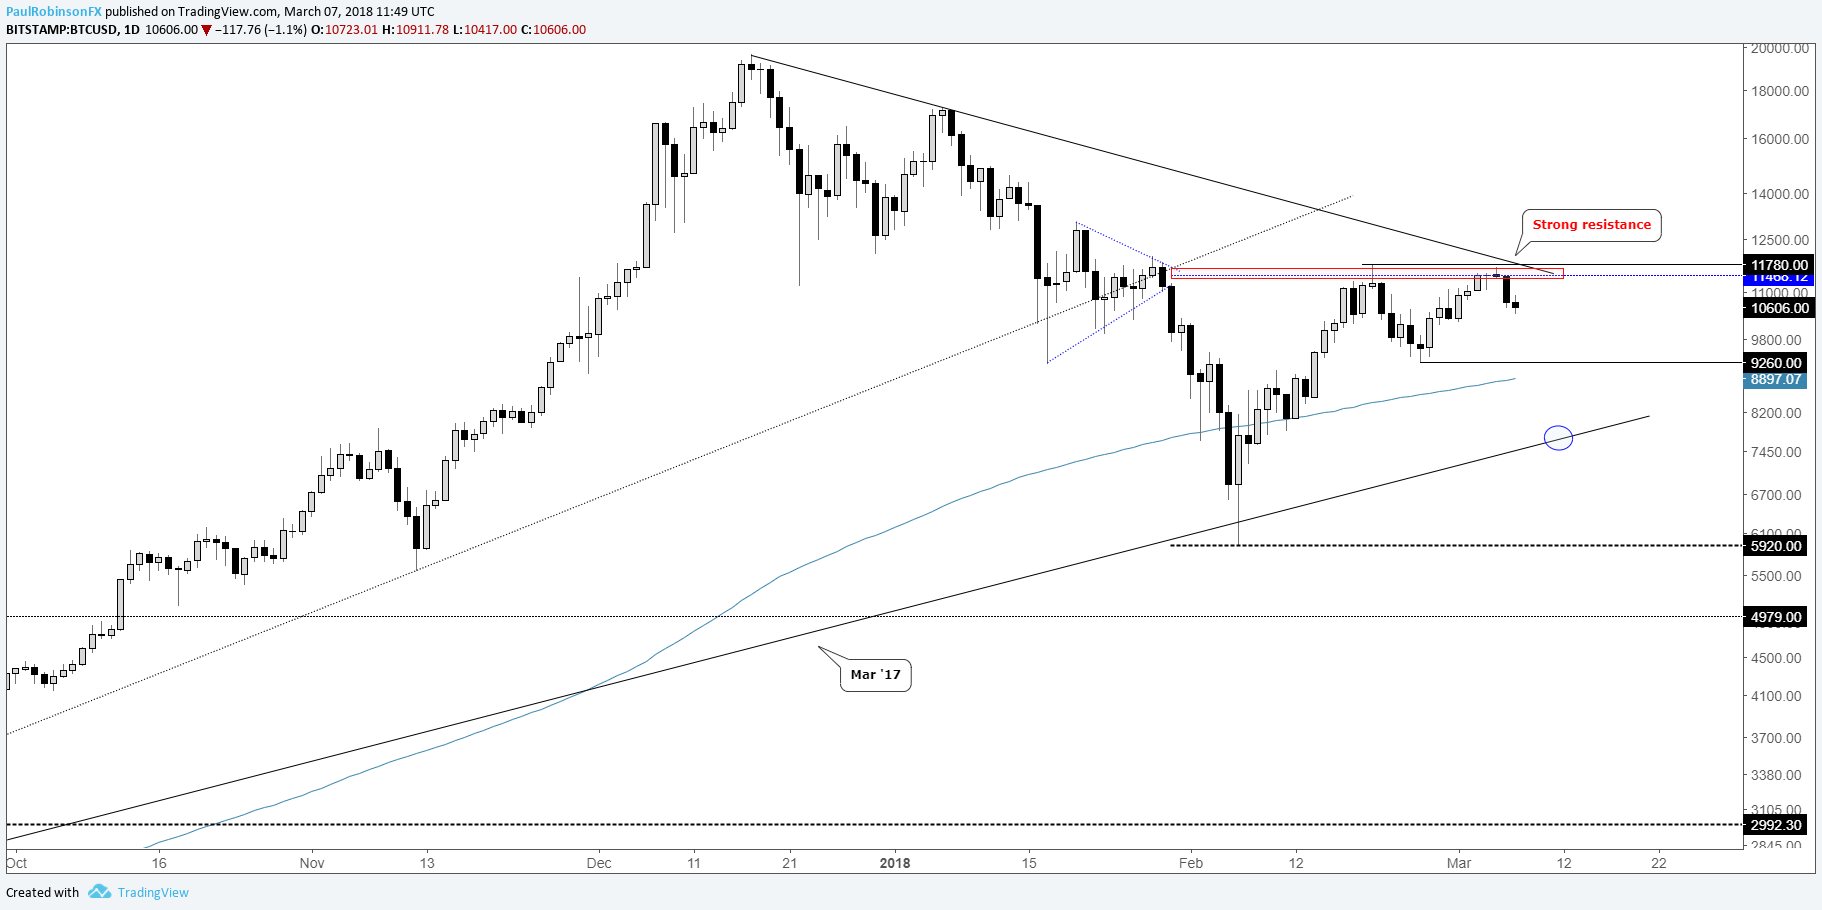
Bitcoin is turning down from resistance, again
Bitcoin rallied a bit recently, but that could quickly change (already is at the moment). While the two aforementioned cryptocurrencies have clean levels of support, resistance in BTC/USD has become quite clear around the apex of the wedge breakdown in January. With the trend-line of the record high just beyond the recent swing high, the zone of resistance extends from 11550 up to 11800.
Stay below and the outlook is neutral at best, and likely bearish (especially if the others break support). Looking lower, 9260 sticks out immediately as price support, quickly followed by the 200-day MA near 8900. The first big line of rising support comes in at a trend-line extending higher from March 2017, then price support at the Feb spike-low at 5920.
A full clearance above all aforementioned resistance is needed to turn the picture in favor of more upside.
BTC/USD Daily Chart (rolling over from resistance)
Resources for Cryptocurrency Traders
Whether you’re a new or experienced cryptocurrency trader, we have several resources to help you;Introduction to bitcoin trading guide, indicator for tracking trader sentiment, and a weekly webinar discussing the latest developments.
---Written by Paul Robinson, Market Analyst
To receive Paul’s analysis directly via email, please SIGN UP HERE
You can follow Paul on Twitter at @PaulRobinsonFX


