


Cryptocurrency Highlights:
- Declines expected to get worse with intermittent rallies
- Bitcoin, Litecoin, Ripple broke important levels
- Ethereum finally breaking with the rest
See how traders are positioned in Cryptocurrencies and what it might mean on the IG Client Sentiment page.
Declines expected to get worse with intermittent rallies
Back a couple of weeks ago, we discussed the possibility that the ‘animal spirits’ of the rise have been tamed and charts in the cryptocurrency market are broken, and as a result massive declines would unfold. The parabolic ‘tulip mania’ rise is moving in reverse, which means much lower levels are expected. There will be intermittent rallies, but overall, it looks like the selling could go on for a while.
Bitcoin, Litecoin, Ripple broke important levels
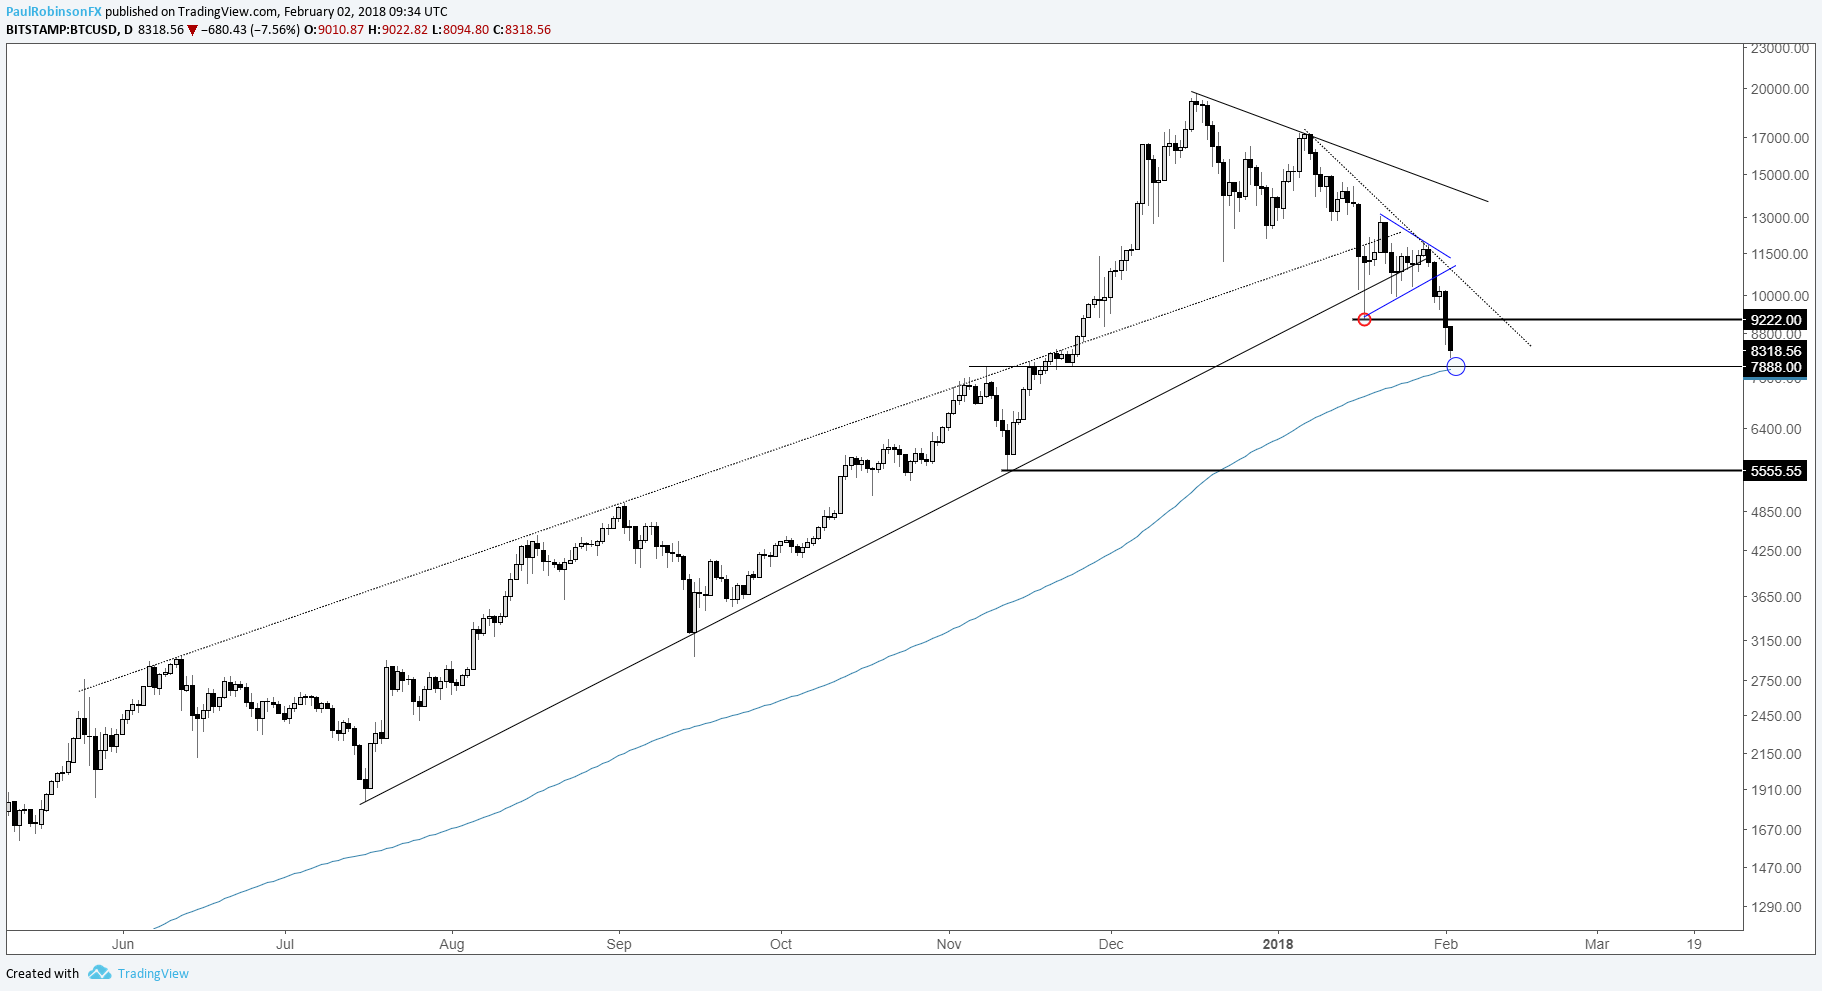
For Bitcoin, 7888 in confluence with the 200-day MA may bring some relief, but not looking for it to do much more than that. Rallies are expected to be short-lived events, rather than sustaining moves higher. With that said, the November low at 5555 is the next big downside target.
Chart 1 – BTC/USD: Daily
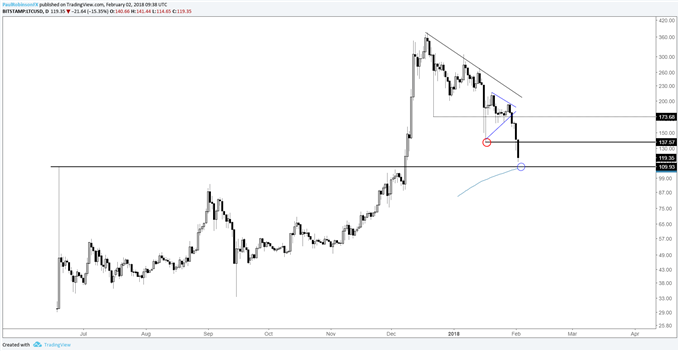
Litecoin is dropping sharply after breaking out of a wedge, it’s trading below the Jan 17 level of 137.57 noted as important, which brings us to 110. The 200-day, as is the case with Bitcoin, also arrives around price support. Perhaps a relief bounce soon, but look for more weakness to follow.
Chart 2 – LTC/USD: Daily
Want to learn more about cryptocurrencies? Check out this guide, Introduction to Bitcoin Trading
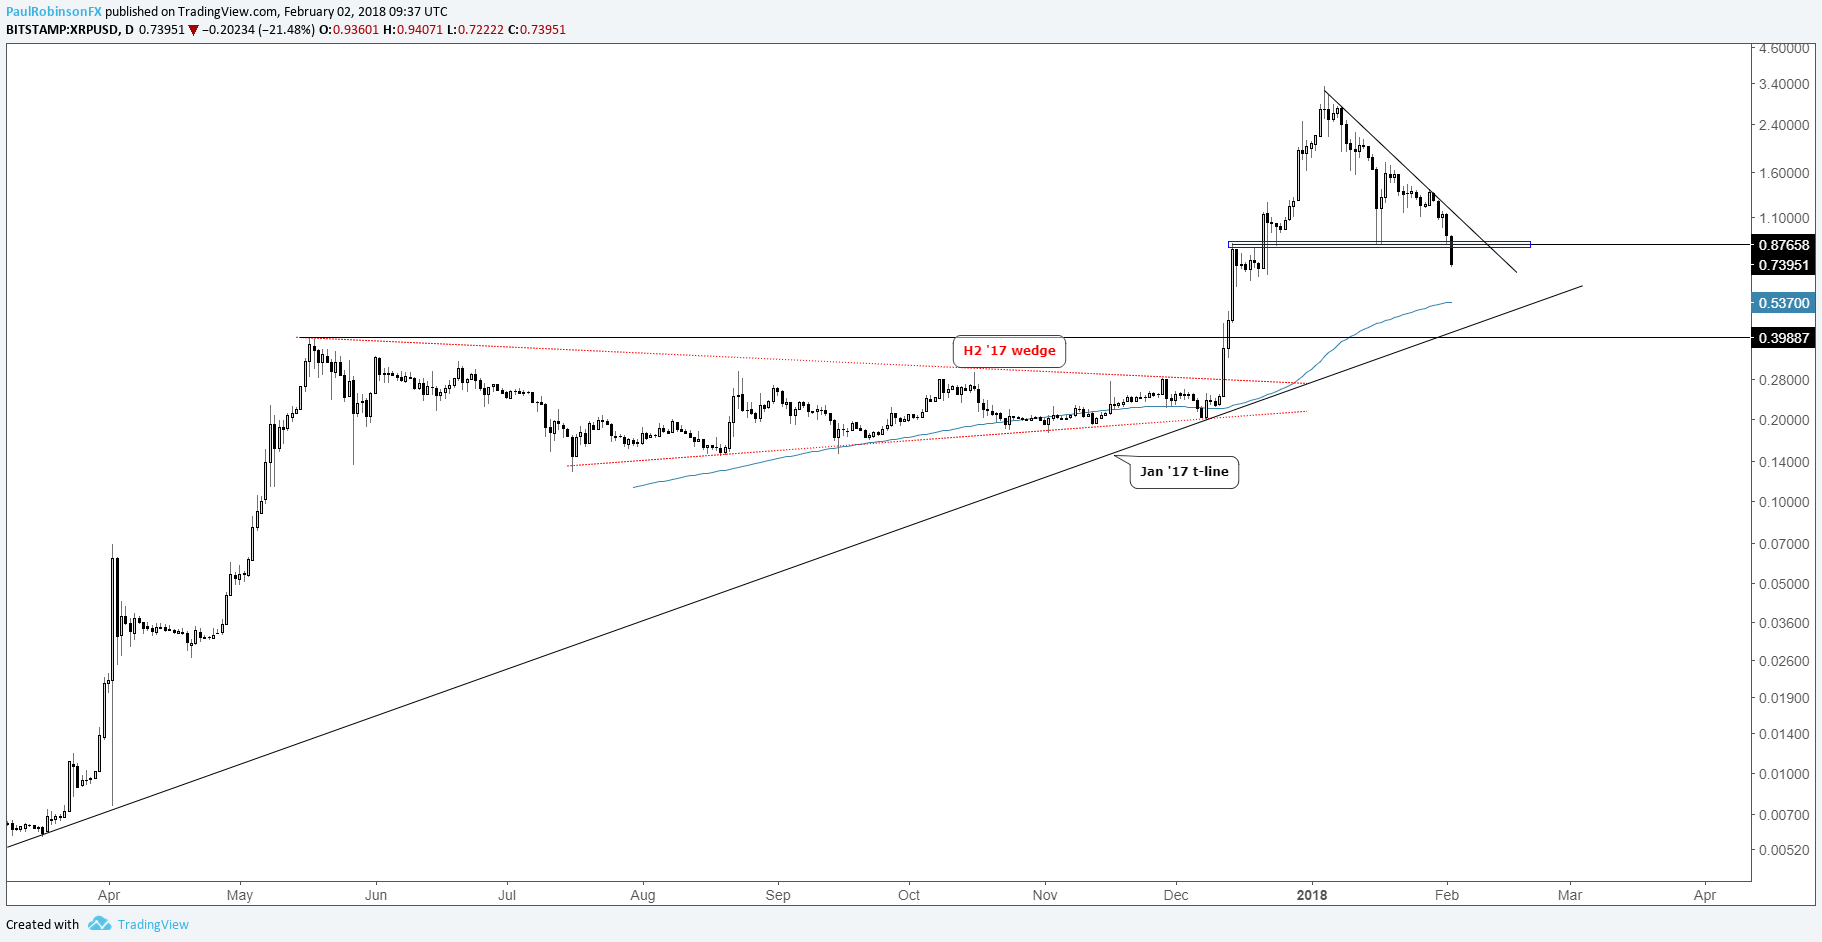
The Ripple ‘drip-drip-drip’ price action is turning into a waterfall. The 87-cent threshold has been broken as of the time of this writing, with the 50-cent area next up. At some point it looks like the rally from the wedge that formed during the second half of 2017 will get fully erased, taking Ripple back down to around 25-cents, or so.
Chart 3 – XRP/USD: Daily
Ethereum is finally breaking too
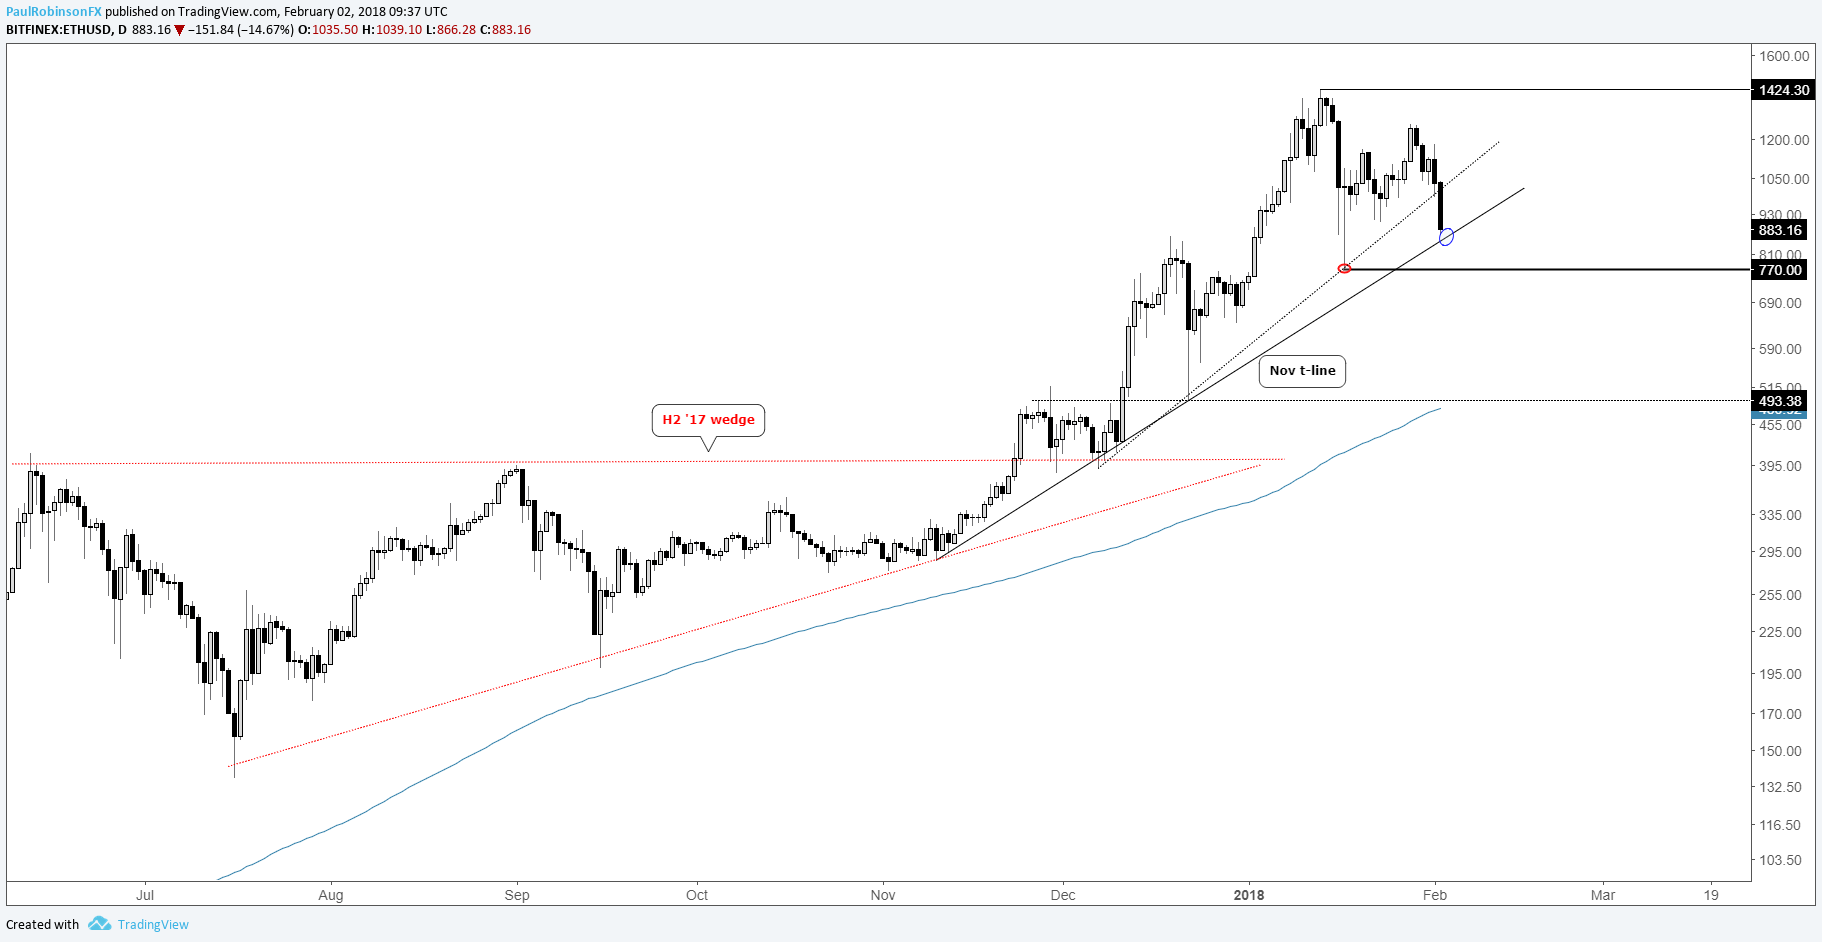
Ethereum has been a hold-out for the most part, but that is quickly changing. The short-lived rise which ended back on Jan 28 is now turning out to be a major lower-high. The November trend-line is quickly coming into play, with a break expected.
Below there, the same Jan 17 spike-lows the others have broken is up next at 770. As did the others, the expectation is it won't hold and lead to a decline to under 500, with the rally from the H2 '17 wedge also getting erased to around 400. It may not happen in a straight line, but there isn’t much to prevent Ethereum from getting there in a fairly short period of time.
Chart 4 – ETH/USD: Daily
Whether you’re a new or experienced cryptocurrency trader, we have several resources to help you;Introduction to bitcoin trading guide, indicator for tracking trader sentiment, and a weekly webinar discussing the latest developments.
---Written by Paul Robinson, Market Analyst
To receive Paul’s analysis directly via email, please SIGN UP HERE
You can follow Paul on Twitter at @PaulRobinsonFX


