


What’s inside:
- BTC/USD goes wild and puts in an extraordinarily volatile day
- Very volatile price action created a candlestick with bearish implications
- May not be ‘the’ top, but a major correction could be about to get underway
Find out what other traders are doing in Bitcoin with the IG Client Sentiment tool.
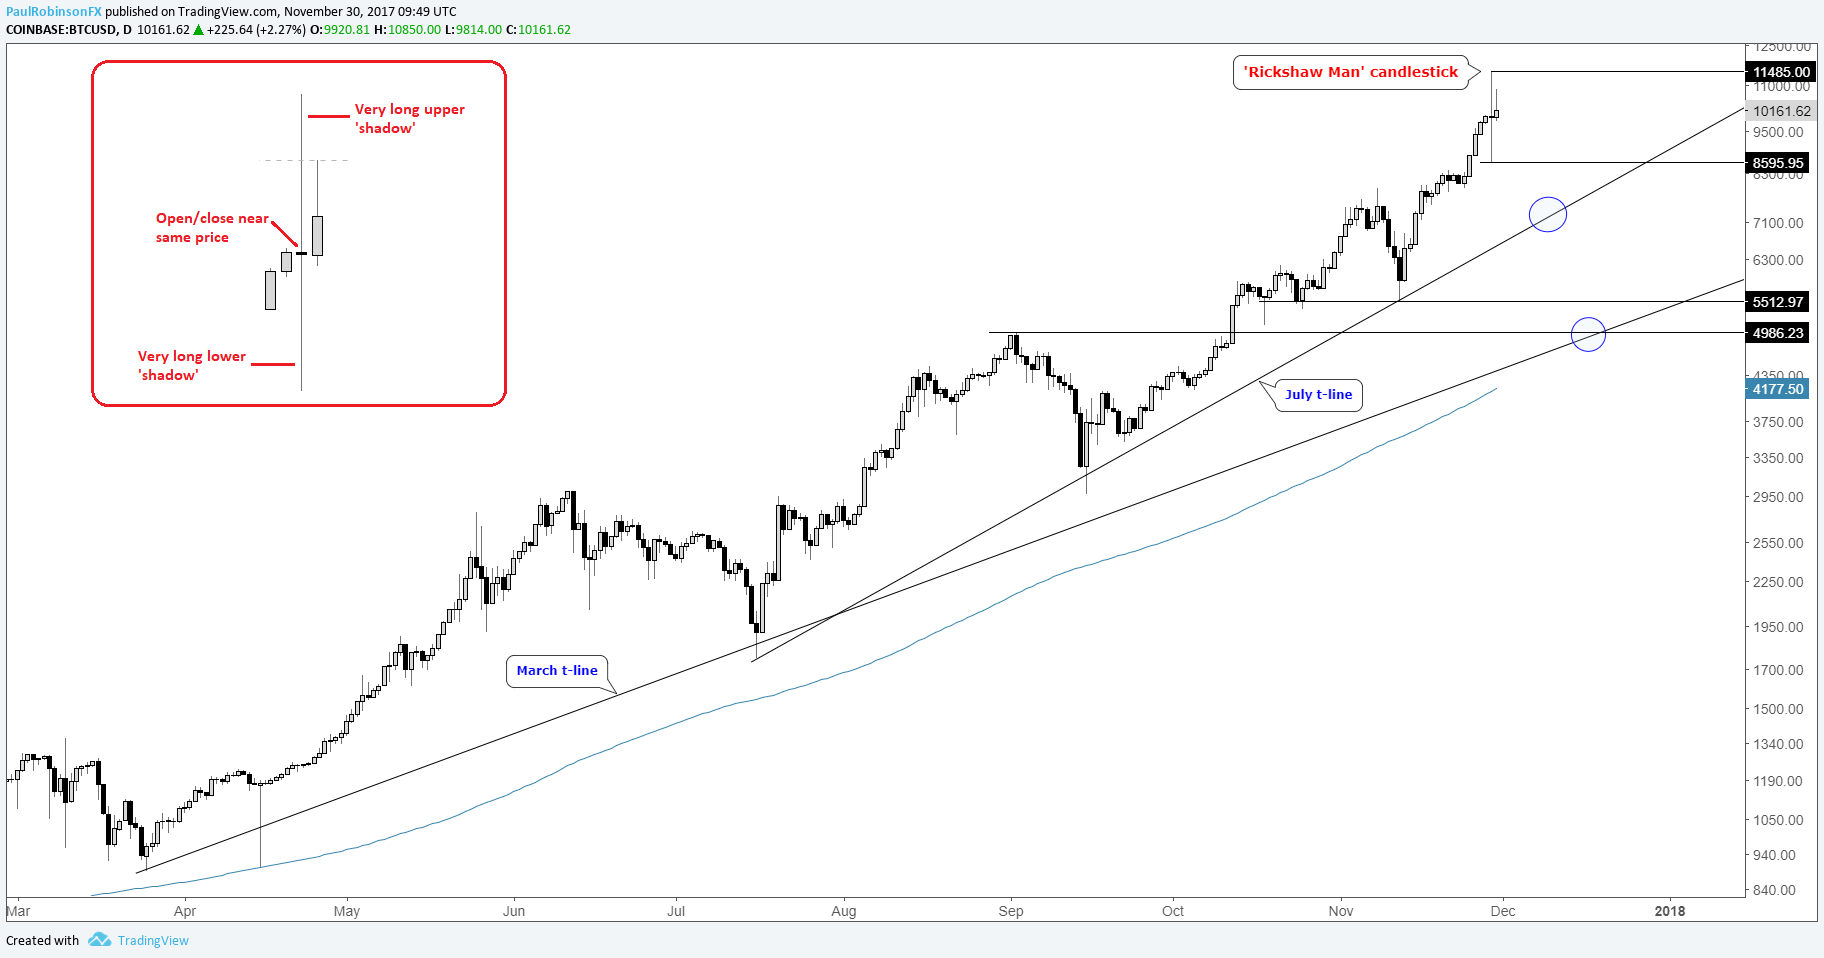
It hasn’t paid to be bearish cryptocurrencies, ask anyone who has done it. Maybe for some dips here and there, but otherwise it’s been a one-way freight train. The leader of the pack, Bitcoin, has been shredding anyone who bets against it. Yesterday was a one wild session with a nearly 3000-point range. The extreme volatility posted a very important candlestick formation, one you don’t see often. A ‘Rickshaw Man’, or some of you might know it as a ‘long-legged’ doji. These particular candlesticks can mark important turning points. The extreme volatility as evidenced by the long ‘shadows’ above and below the opening and closing values (which are very near one another) indicates a major push-pull struggle between buyers and sellers. When coming after a run like what we’ve seen it takes on even more importance in its appearance.
Breaking out the ‘log’ chart, scaled to put the parabolic rise into perspective; it would be reasonable, in Bitcoin’s world even normal, to see a 30-60% decline from current levels. And still be bullish.
There are a pair of trend-lines which we’ll have our eyes on should we start to see BTC/USD start rolling downhill. The first is rising up from the July low and currently arrives somewhere in the vicinity of ~7000/300. There is price support below that point just above 5500, and not far below there lies a trend-line dating back to March when the crypto was trading sub-900. This line clocks in somewhere in the low 5000s. These trend-lines are moving targets given the angle and timing of when (if) should they be met. There could be confluence at that point between trend-line and horizontal levels. Perhaps that will be the next time traders look to load up long, but for now it looks riskier than at any time during the rise to not exercise caution from the long-side.
Check out this guide for ideas on how to Build Confidence in Trading.
BTC/USD (Coinbase): Daily
---Written by Paul Robinson, Market Analyst
You can receive Paul’s analysis directly via email by signing up here.
You can follow Paul on Twitter at @PaulRobinonFX.


