


CRUDE OIL PRICE WEEKLY TECHNICAL FORECAST: BEARISH
- Crude oil prices crumbled following a sharp rejection of technical resistance, opening the door to retest August’s swing low
- Another spike higher in crude oil volatility could suggest selling pressure may continue
- Find out the Top Crude Oil Facts Every Trader Should Know
Crude oil prices sank over 1.5% this past week in choppy trading. I noted early last Tuesday that crude oil prices were showing signs of weakness as volatility climbed amid lingering US-China trade war uncertainty as Jackson Hole loomed. Surely enough, the expectation came to fruition as bearish fundamentals aligned with a technical backdrop that pointed to the possibility of sustained selling pressure.
CRUDE OIL PRICE CHART: DAILY TIME FRAME (DECEMBER 20, 2018 TO AUGUST 23, 2019)
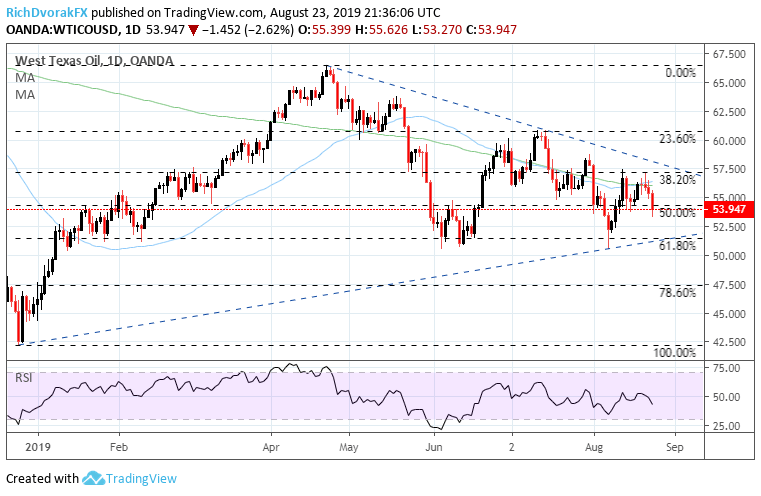
Chart created by @RichDvorakFX with TradingView
This past week’s drop in the price of crude oil appears to reiterate the commodity’s broad symmetrical triangle pattern that has emerged so far this year with price action coiling into a tighter wedge between higher lows and lower highs. Yet, last Wednesday’s hard rejection of the 57.00 price zone – a confluent level of resistance offered by the 38.2% Fibonacci retracement level of oil’s 55% climb off its December 2018 swing low – stands to underscore bearish crude oil price action. Also, crude oil prices sinking below the mid-point of the previously mentioned bullish leg highlights the dramatic selling pressure recently exerted on the commodity. This comes amid heightened Sino-American tensions as the trade war rages on.
Evidence of waning bullish prospects for crude oil prices from a technical standpoint is also suggested by the wilting RSI as the indicator dipped back below 50 and looks to continue its overarching trend lower since April. Moreover, the struggle to reclaim the 50-day and 200-day simple moving averages may keep a lid on any rebound attempt.
CRUDE OIL & OIL VOLATILITY INDEX PRICE CHART: DAILY TIME FRAME (AUGUST 20, 2018 TO AUGUST 23, 2019)
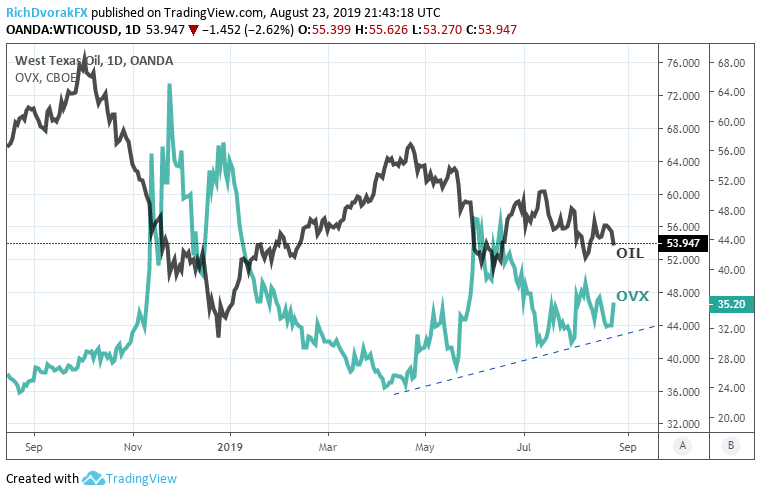
Chart created by @RichDvorakFX with TradingView
For nearly all risk assets like crude oil and stocks, a rise in market volatility typically holds an inverse relationship with price action. Crude oil volatility, measured via Cboe’s Oil Price Volatility Index (OVX), continues to creep higher. That said, the most recent spike in OVX - owing to China’s retaliatory tariffs and Trump’s response on Twitter - could point to the market’s elevated degree of uncertainty and risk aversion, thus hinting at further weakness in crude oil prices ahead.
CRUDE OIL PRICE CHART: 4-HOUR TIME FRAME (JULY 29, 2019 TO AUGUST 23, 2019)

Chart created by @RichDvorakFX with TradingView
In the scenario where markets find themselves in turmoil with bearish price action carrying over into next week, crude oil could continue to crumble under the pressure of macro headwinds. The commodity’s trading range since late July offers technical levels of confluence around the 38.2% and 23.6% Fibonacci retracement levels, which may be looked upon for potential areas of buoyancy. While a rebound back toward $55.00 could be in the cards, upside progress will likely prove short-lived as crude oil price action gets strong-armed lower. As such, the path of least resistance for crude oil next week could be a retest of the month-to-date swing low slightly beneath the $51.00 price level.
-- Written by Rich Dvorak, Junior Analyst for DailyFX.com
Connect with @RichDvorakFX on Twitter for real-time market insight


