


- AUD/USD weekly tweezer bottom
- Heads up on a USD/CHF breakout attempt
- Nikkei 225 rips from well-defined support
-- Subscribe to Jamie Saettele's distribution list in order to receive a free report to your inbox several times a week.
--For more analysis and trade setups (including current positions and the ‘watchlist’), visit SB Trade Desk
Weekly
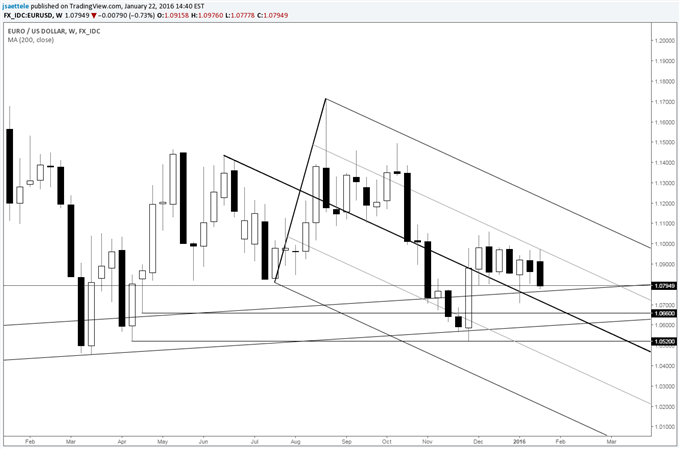
Chart Prepared by Jamie Saettele, CMT
Automate trades with Mirror Trader
-Long term comments remain valid – “EUR/USD has been holding its long term trendline support since March 2015 (even the January low is right on the line). November and December trade produced a tweezer bottom (reversal candlestick pattern…bullish in this case) as well. 2 scenarios seem most likely from the current juncture; a continued range (with roughly 1.15 resistance) or a bullish base that leads to an eventual breakout into the 1.20s.”
-Near term, FXTW suggests watching for support on the shorter term median line (bold black line on the chart above) in the mid-1.0600s. The market has been in a tight range since December. Such conditions aren’t conducive to SSI breakout strategies. However, ranges precede directional moves so don’t dismiss such strategies outright.
-For forecasts and 2016 opportunities, check out the DailyFX Trading Guides.
Weekly
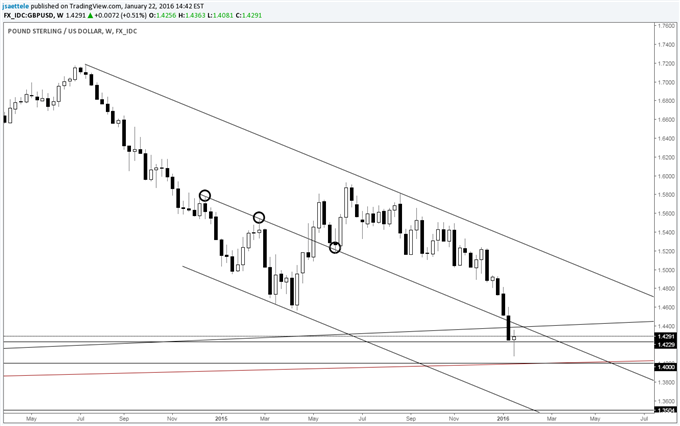
Chart Prepared by Jamie Saettele, CMT
Automate trades with Mirror Trader
-FXTW wrote last week that “unlike EUR/USD, GBP/USD has failed to hold its trendline that originates at the 1985 low (this is the case as of noon in NY Friday…the line is at about 1.4390). The cross is on the verge of taking out the 2010 low at 1.4229, which would put GBP/USD at its lowest level since March 2009. The next market level that might stem the freefall is the 1.40…in part due to the psychological aspect of the figure but also because of the presence of a parallel (parallel to line that extends off of the 1992 and 2007 highs).” Cable bounced higher this week but price needs to establish above 1.4400 (see trendline confluence on the chart) in order to suggest that even a short term low is in place.
AUD/USD
Weekly
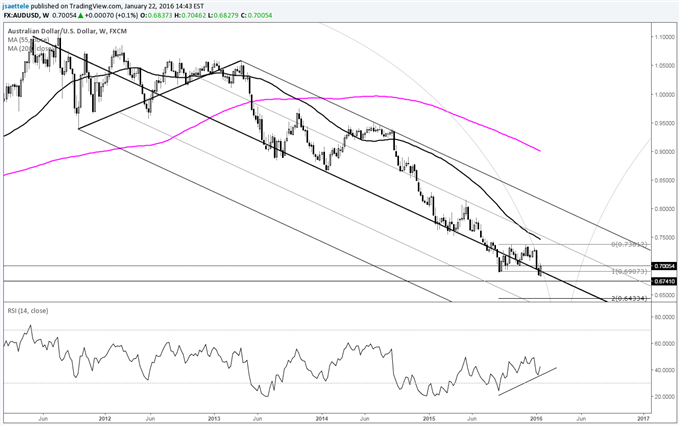
Chart Prepared by Jamie Saettele, CMT
Automate trades with Mirror Trader
-Recent AUD/USD comments were that “the dominant downtrend is very much intact but there have been prolonged periods of trading around this median line that gave way to decent counter trend moves (rallies). In other words, everything since the September low may very well be corrective but AUD/USD could trade in a more or less nonsensical range for a while longer before the downtrend attempts to reassert.” Corrective (range bound) trading behavior may very well continue given this week’s tweezer bottom (at the long term median line no less). Divergence with RSI on the weekly serves as a bullish reversal warning too.
Weekly
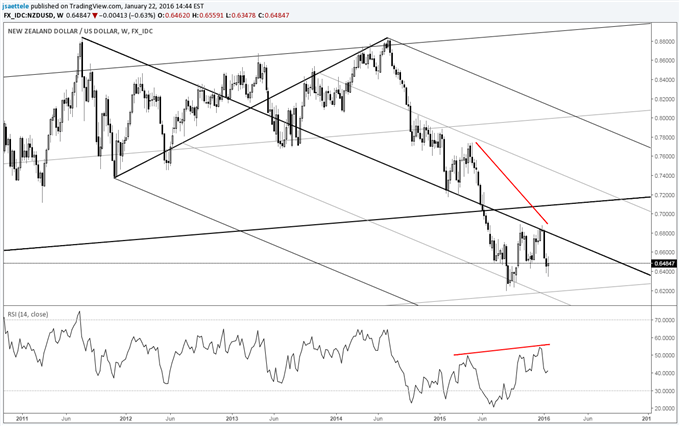
Chart Prepared by Jamie Saettele, CMT
Automate trades with Mirror Trader
-FXTW wrote in the most recent update that “the recent top was a bit above .6805…at .6882 but price did remain below the October high. In fact, the October and December highs create a double top within the longer term downtrend. The red lines on the chart indicate a long term RSI trend sell signal (higher RSI and lower price).” The October high remains critical to any bearish interpretation. Like AUD/USD, a period of range trading may be in store given the recovery from under the November low.
Weekly
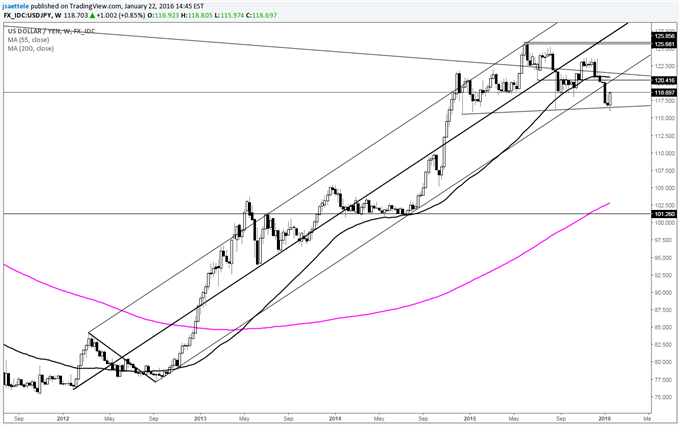
Chart Prepared by Jamie Saettele, CMT
Automate trades with Mirror Trader
-The most recent FXTW note was “the uptrend that USD/JPY enjoyed since the December 2012 breakout is over. The cross topped nearly 7 months ago at a long term trendline. All of this doesn’t mean that USD/JPY can’t or won’t experience rallies. All of this does mean that rallies should be sold. Be patient and use stops, as outlined in the popular TOST series. As noted in the Q1 technical outlook, a head and shoulders pattern yields a target near 105.” We got a rally! In fact, the rally materialized following a test of the neckline from a year-long head and shoulders pattern. Watch former support (lower parallel from previously bullish market and 55 week average) for resistance.
Monthly
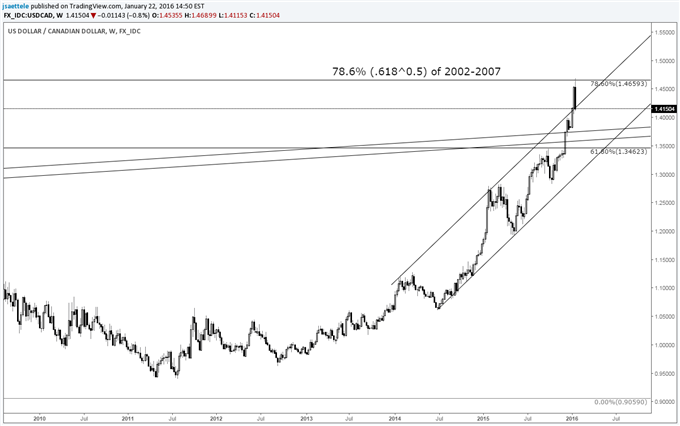
Chart Prepared by Jamie Saettele, CMT
Automate trades with Mirror Trader
-The most recent FXTW comments were that “extremely long term slope analysis reveals that the 1976-1991 line, which was resistance (not precise however), could end up as support again on the next ‘correction’. That line is around 1.3600. If USD/CAD is going to ‘correct’, which might it correct from? At this point, I’d watch the 78.6% retracement of the decline from the 2002-2007 decline. The Fib is 1.4659.” The high this week was 1.4689 and USD/CAD reversed sharply. A top of some importance could be in place.
USD/CHF
Weekly
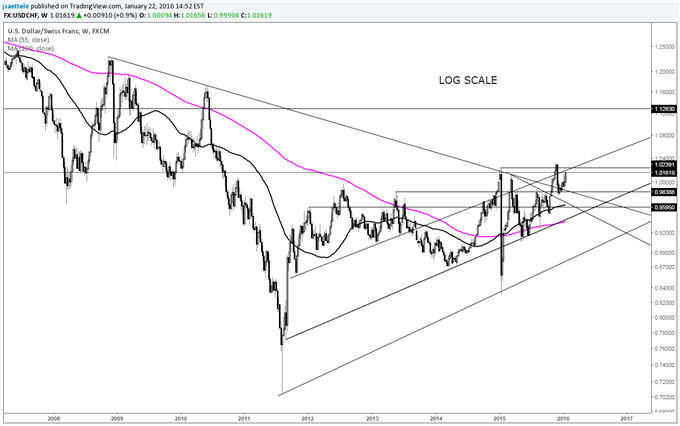
Chart Prepared by Jamie Saettele, CMT
Automate trades with Mirror Trader
-Some extremely long term technical considerations are worthy of note when looking at USD/CHF. Read about them here. This week’s advance brings the cross less than 2 big figures away from multiyear highs so another breakout attempt (first one was in November) may be near.
BONUS CHART
Nikkei 225
Weekly
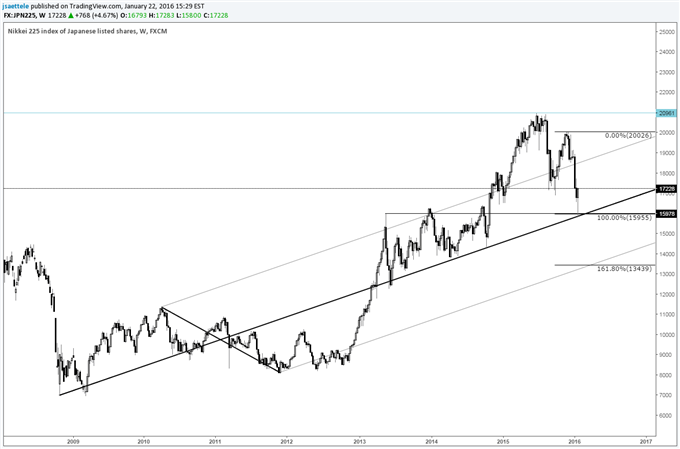
Chart Prepared by Jamie Saettele, CMT
-Major stock markets reversed sharply higher this week but the ‘cleanest’ market with respect to where the low registered is the Nikkei 225. The low in Japan was just below where the decline from the June high would consist of 2 equal legs (hallmark of corrections…whether this is over remains to be seen). The level is also marked by the May 2013 high. FXTW believes that the most precise method of support/resistance identification is ‘slope identification’ (also the preferred tool at SB Trade Desk). Such was the case this week as the low was RIGHT at a long term median line. This is the same line that provided support throughout 2013 and 2014. Only the October 2014 low resulted in a V-bottom. That outcome seems unlikely now given several technical factors such as the break of and change in slope of longer term moving averages. Rather, a range period may be in store between this week’s low and roughly 18500.


