


-- Subscribe to Jamie Saettele's distribution list in order to receive a free report to your inbox thrice a week.
Weekly
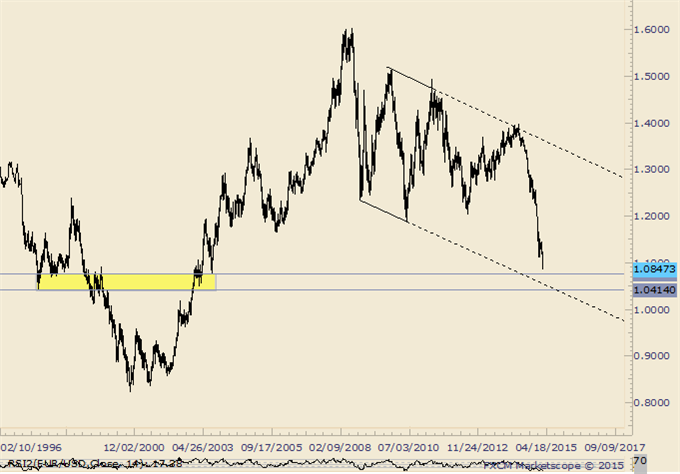
Chart Prepared by Jamie Saettele, CMT using Marketscope 2.0
Automate trades with Mirror Trader
-“BIG picture, monthly RSI has broken out of a triangle pattern. Sometimes, a pattern breakout in momentum (or OBV) precedes the breakout in price. The development’s implications are obviously significant.”
-The only thing in the way of this swan dive is the 1997 low at 1.0414, the September 2003 low at 1.0765, and a line that extends off of the 2008 and 2010 lows at about 1.0600 this month.
GBP/USD
Weekly
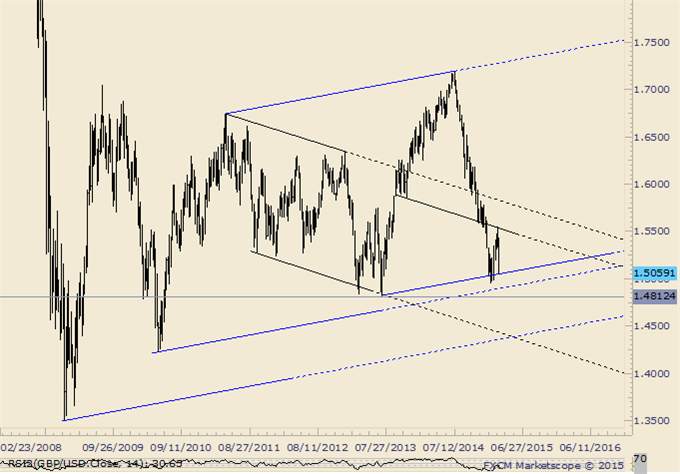
Chart Prepared by Jamie Saettele, CMT using Marketscope 2.0
Automate trades with Mirror Trader
-“A breakout from a 1 month inverse head and shoulders pattern is valid above today’s low (breakout day) but GBPUSD does face channel resistance at this level. The reversal pattern’s objective is 1.5494, which is in line with the December low at 1.5485.”
-“GBPUSD met the target and traded into the mid-1.5500s this week. There is good resistance here from former lows and slopes on multiple time frames.” A breakdown towards 1.4250-1.4350 may be underway.
Daily
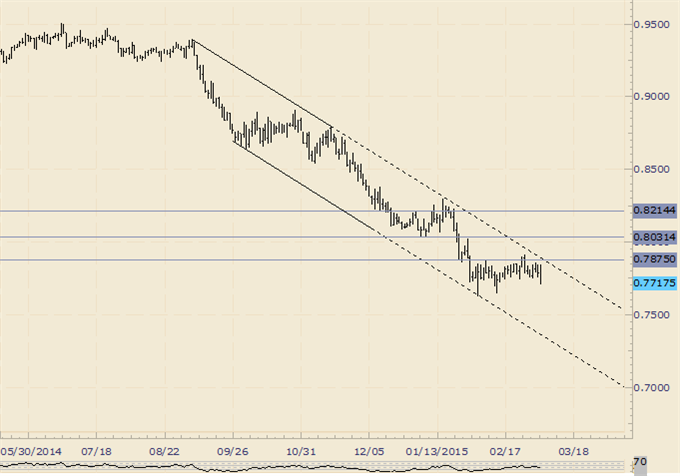
Chart Prepared by Jamie Saettele, CMT using Marketscope 2.0
Automate trades with Mirror Trader
-“AUDUSD has consolidated since the 2/3 high volume reversal. The rate also registered a weekly key reversal which is a good way to begin at least a countertrend move (higher). .8030/50 sticks out as resistance over the next several weeks if AUDUSD can break above .7875.” Today’s (2/26) reversal comes just shy of channel resistance. As long as price is contained by channel resistance, downside resolution remains possible.
Weekly
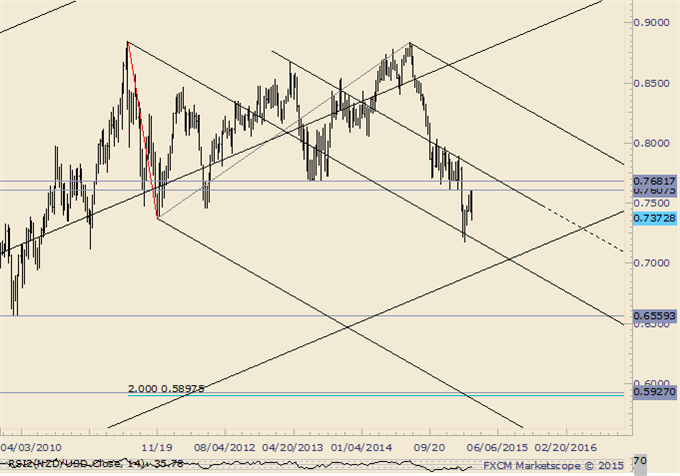
Chart Prepared by Jamie Saettele, CMT using Marketscope 2.0
Automate trades with Mirror Trader
-“NZDUSD traded to the 61.8% retracement of its 3 year range today (.7929) and the next level of interest probably isn’t until the 2013 Labor Day gap at .7722. One can’t help but notice that an epic double top is possible with a target of .5898. That would trigger on a drop below .7370.”
-“The large double top triggered…but the breakout has proven false to this point. The December low (.7608) served as resistance this week.” The strong rejection of strength at the December low is bearish.
USD/JPY
Weekly
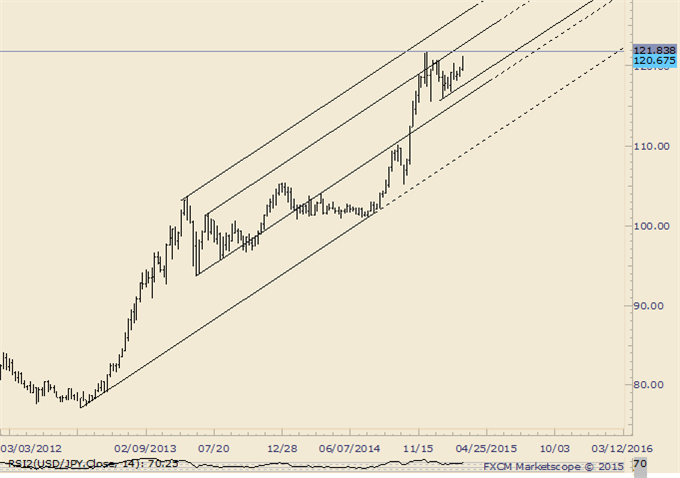
Chart Prepared by Jamie Saettele, CMT using Marketscope 2.0
Automate trades with Mirror Trader
-“Continue to favor a broad range as 119.80-120.70 as resistance and 116.40-117.10 as support. A move through either one of these zones would define target zones of 124-128 and 110-114.”
-USDJPY is flirting with a breakout from the cited resistance zone (120.70). The next level of interest on the upside would be 124.13.
Weekly
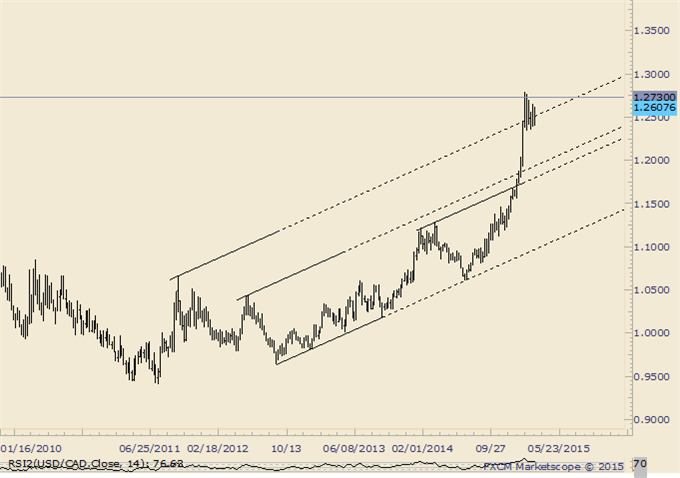
Chart Prepared by Jamie Saettele, CMT using Marketscope 2.0
Automate trades with Mirror Trader
-“USDCAD has pushed through the 2007 high at 1.1875, 61.8% extension of the 2007-2009 rally from the 2011 low at 1.1882, and several upward sloping parallels. The next cluster of technical levels is between 1.25 and 1.2730.”
-Near term, the contracting range indicates potential for a triangle. Typically, a triangle will lead to a thrust in the direction of the preceding trend. In this case, that would mean a move higher with targets at 1.3075 and 1.3246.
Weekly
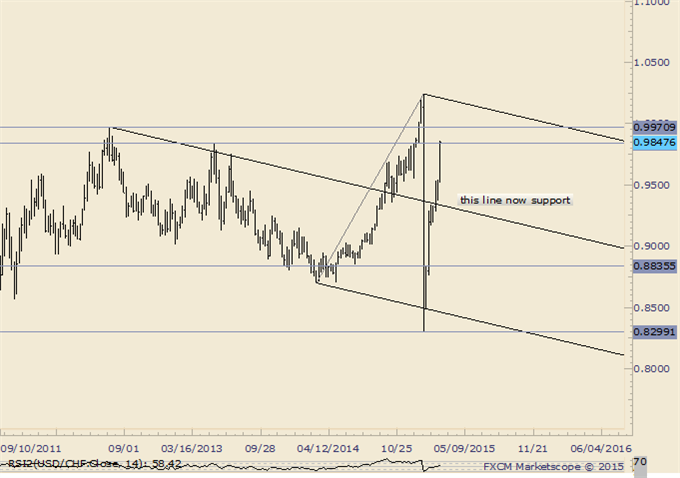
Chart Prepared by Jamie Saettele, CMT using Marketscope 2.0
Automate trades with Mirror Trader
-“Since banging off of a lower parallel (after SNB), USDCHF has rallied and is just pips from the median line of that structure. The line in question is just pips from the October 2014 low at .9352. Watch for resistance. A reaction targets .8820/30 as support. A move over the mentioned median line opens up .9530/50 (November and December 2014 lows).”
-USDCHF has pushed through the mentioned through the mentioned line and is pressing against the December low. Watch the median line for support now…probably near .9300/40.


