


- GBPUSD responds to slope resistance
- AUDUSD faces channel resistance
- NZDUSD rally stalls at December low
-- Subscribe to Jamie Saettele's distribution list in order to receive a free report to your inbox thrice a week.
Weekly
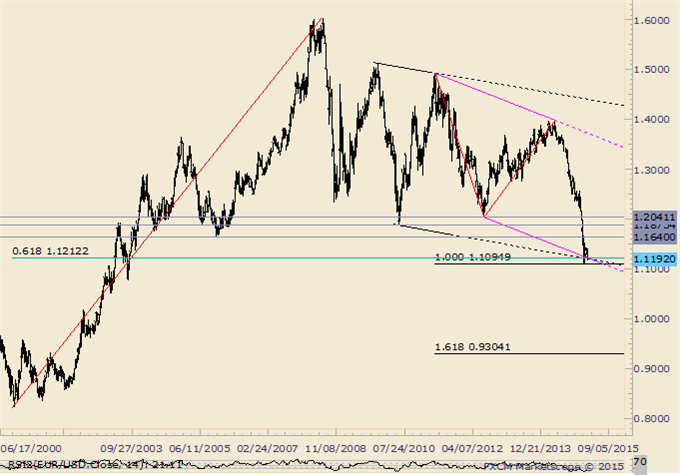
Chart Prepared by Jamie Saettele, CMT using Marketscope 2.0
Automate trades with Mirror Trader
-“BIG picture, monthly RSI has broken out of a triangle pattern. Sometimes, a pattern breakout in momentum (or OBV) precedes the breakout in price. The development’s implications are obviously significant.”
-A number of calls for parity have been published recently. While the long term pattern suggests an eventual print near .90, the sudden aggressively bearish calls come just after a record small speculator short position and record open interest in euro futures was recorded in November. The same COT profile was evident in May 2012, before the EURUSD bottomed in July. Aggressive forecasts are often published when it’s comfortable to do so, which means that the trend is embedded in the public consciousness to the point of extremity. The path to .90 or so won’t be smooth (in other words…more 2 way trade). Former support may provide resistance from 1.1640 to 1.2040.
Weekly
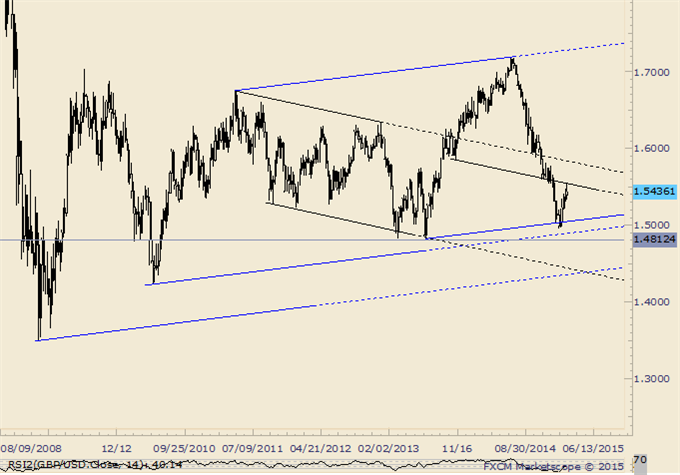
Chart Prepared by Jamie Saettele, CMT using Marketscope 2.0
Automate trades with Mirror Trader
-“A breakout from a 1 month inverse head and shoulders pattern is valid above today’s low (breakout day) but GBPUSD does face channel resistance at this level. The reversal pattern’s objective is 1.5494, which is in line with the December low at 1.5485.”
-GBPUSD met the target and traded into the mid-1.5500s this week. There is good resistance here from former lows and slopes on multiple time frames.
AUD/USD
Weekly
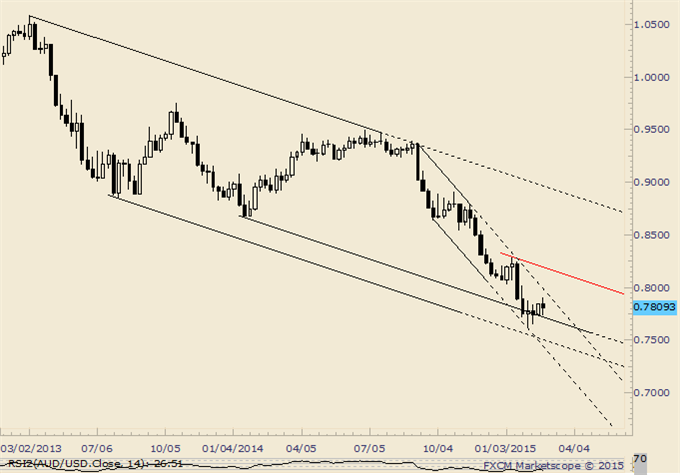
Chart Prepared by Jamie Saettele, CMT using Marketscope 2.0
Automate trades with Mirror Trader
-“AUDUSD may be trying to put in a floor of sorts as the rate has held up since putting in a large range and volume reversal on Tuesday. The larger trend remains lower however with resistance estimated at .8030/50. The next potentially important support probably isn’t until the 61.8% retracement of the 2001-2011 rally at .7183.”
-“The last 2 weekly candles (key reversal and inside doji), at slope support mind you, are consistent with a near term change in behavior.” The market has held up but nearby channel resistance could derail the trip to .8030/50.
NZD/USD
Weekly
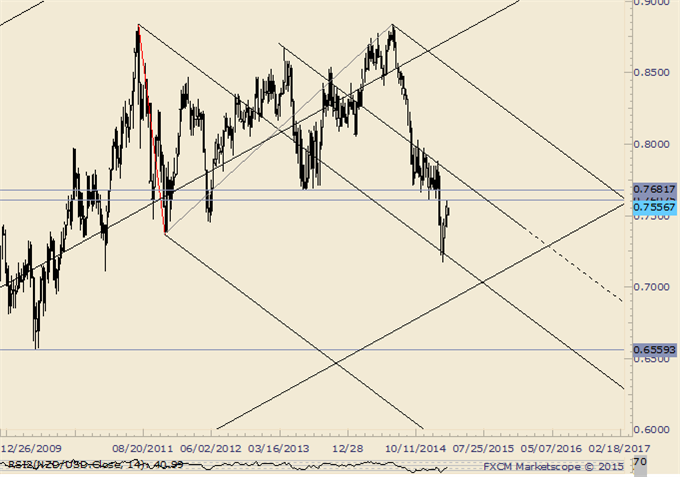
Chart Prepared by Jamie Saettele, CMT using Marketscope 2.0
Automate trades with Mirror Trader
-“NZDUSD traded to the 61.8% retracement of its 3 year range today (.7929) and the next level of interest probably isn’t until the 2013 Labor Day gap at .7722. One can’t help but notice that an epic double top is possible with a target of .5898. That would trigger on a drop below .7370.”
-The large double top triggered…but the breakout has proven false to this point. The December low (.7608) served as resistance this week. In time, the 2013 low (.7682) could come into play as resistance.
Weekly
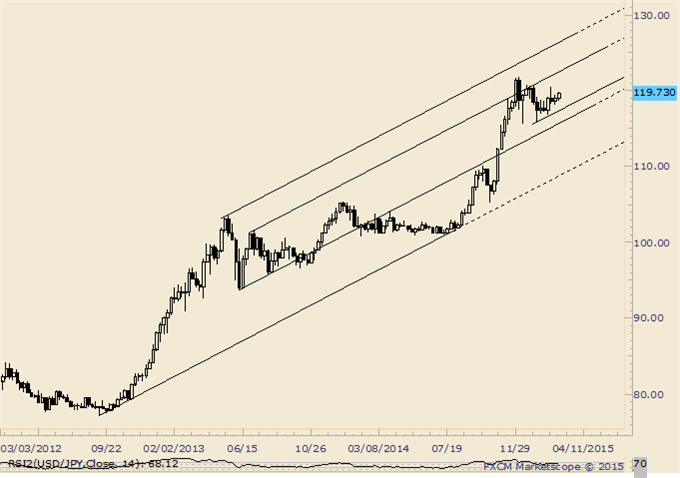
Chart Prepared by Jamie Saettele, CMT using Marketscope 2.0
Automate trades with Mirror Trader
-“Continue to favor a broad range as 119.80-120.70 as resistance and 116.40-117.10 as support. A move through either one of these zones would define target zones of 124-128 and 110-114.”
-Early month trade is always important but even more so as USDJPY is going to begin March near the lower bound of its resistance zone.
Weekly
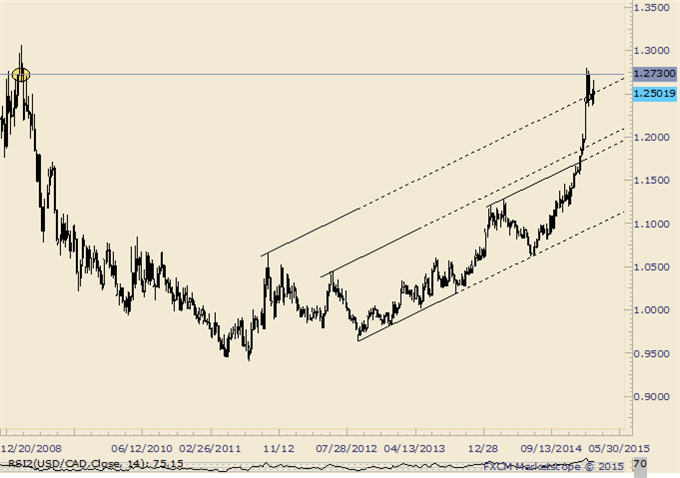
Chart Prepared by Jamie Saettele, CMT using Marketscope 2.0
Automate trades with Mirror Trader
-“USDCAD has pushed through the 2007 high at 1.1875, 61.8% extension of the 2007-2009 rally from the 2011 low at 1.1882, and several upward sloping parallels. The next cluster of technical levels is between 1.25 and 1.2730.”
-Near term, the contracting range indicates potential for a triangle. Typically, a triangle will lead to a thrust in the direction of the preceding trend. In this case, that is bullish. Don’t be dogmatic though (especially since long term resistance has been reached at 1.2730). A break of 1.2350 would open up a parallel as support near 1.2200.
Weekly
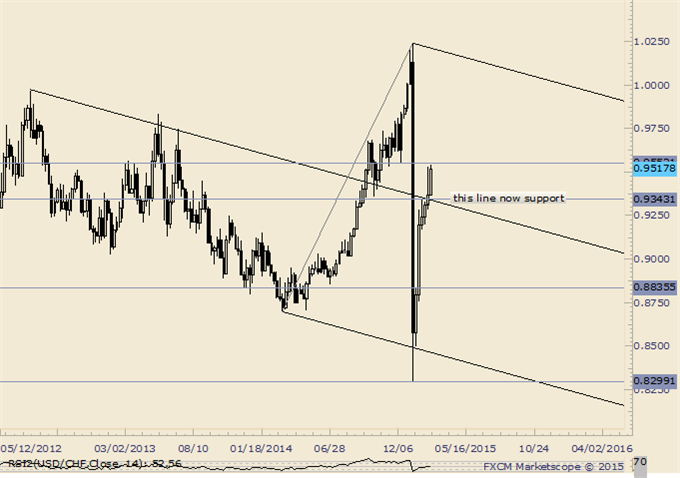
Chart Prepared by Jamie Saettele, CMT using Marketscope 2.0
Automate trades with Mirror Trader
-“Since banging off of a lower parallel (after SNB), USDCHF has rallied and is just pips from the median line of that structure. The line in question is just pips from the October 2014 low at .9352. Watch for resistance. A reaction targets .8820/30 as support. A move over the mentioned median line opens up .9530/50 (November and December 2014 lows).”
-USDCHF has pushed through the mentioned through the mentioned line and is pressing against the December low. Watch the median line for support now…probably near .9300/40.


