


Talking Points
Get real time volume on your charts for free. Click HERE
Foreign Exchange Price & Time at a Glance:
Price & Time Analysis: USD/JPY
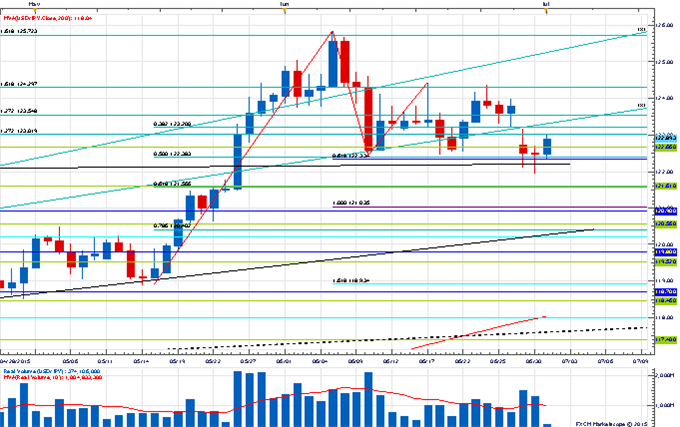
ChartPrepared by Kristian Kerr
- USD/JPY fell to its lowest level in over a month yesterday before finding support just under 122.00
- Our near-term trend bias is lower in USD/JPY while below 124.40
- A key downside attraction remains the December/March closing highs at 121.40
- A turn window of some importantance is seen here
- A close back over 124.40 would turn us positive on rate
USD/JPY Strategy: Like the short side while below 124.40, but reduce them into this turn window.
| Instrument | Support 2 | Support 1 | Spot | Resistance 1 | Resistance 2 |
|---|---|---|---|---|---|
| USD/JPY | *121.40 | 121.90 | 122.90 | 123.30 | *124.40 |
Price & Time Analysis: NZD/USD

ChartPrepared by Kristian Kerr
- NZD/USD broke below the 161.8% extension of the March-April advance at .6800 on Tuesday to trade at its lowest level in over 5-years
- Our near-term trend bias is lower while below .6955
- A close above .6750 is needed to set off the next leg lower in the rate
- A very minor turn window is seen here
- A daily close back above .6955 would turn us positive on the kiwi
NZDUSD Strategy: Like the short side while below .6955.
| Instrument | Support 2 | Support 1 | Spot | Resistance 1 | Resistance 2 |
|---|---|---|---|---|---|
| NZD/USD | .6700 | *.6750 | .6770 | .6800 | *.6955 |
Focus Chart of the Day: USDOLLAR

The medium-term picture at the moment in the FXCM US Dollar Index (equally weighted basket of USD versus EUR, JPY, GBP & AUD) couldn’t be less clear. There is some risk that a broader topping pattern is tracing out, but it would take a move under the May lows (and 200-day moving average) around 11,600 to confirm such a negative shift. There is also plenty of risk that the correction against the primary uptrend has already run its course and USD is set to head higher again, but traction above the June high (and 78.6% retracement of the April-May decline) is desperately needed to confirm such a resumption. In the near-term with the index content to hover around the 50-day moving average (currently 11,850) there is little to do but wait and let things play out. The spike high from Monday at 11,922 and the mid-June low near 11,730 are more immediate pivots to monitor.
To receive Kristian’s analysis directly via email, please SIGN UP HERE.
--- Written by Kristian Kerr, Senior Currency Strategist for DailyFX.com
This publication attempts to further explore the concept that mass movements of human psychology, as represented by the financial markets, are subject to the mathematical laws of nature and through the use of various geometric, arithmetic, statistical and cyclical techniques a better understanding of markets and their corresponding movements can be achieved.
To contact Kristian, e-mail instructor@dailyfx.com. Follow me on Twitter @KKerrFX


