


Talking Points
Get real time volume on your charts for free. Click HERE
Foreign Exchange Price & Time at a Glance:
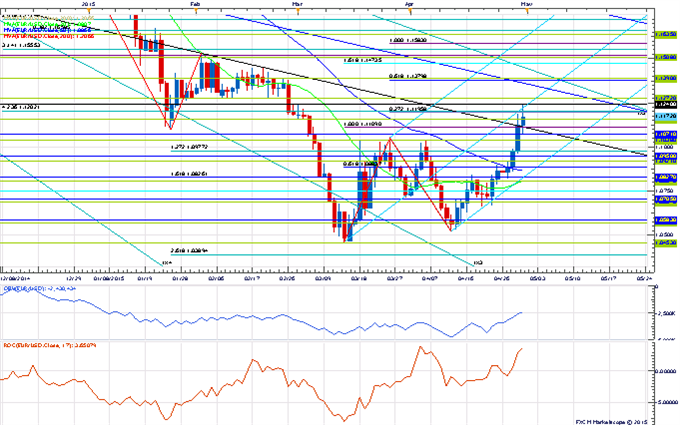
Price & Time Analysis: EUR/USD
Charts Created using Marketscope – Prepared by Kristian Kerr
- EUR/USD traded to its highest level in almost two months this morning before stalling out near the 61.8% retracement of the 2000-2008 advance near 1.1250
- Our near-term trend bias remains higher while above 1.0960
- A close over 1.1250 is needed to re-instill upside momentum in the rate
- A very minor cycle turn window is eyed tomorrow
- A close below 1.0960 would turn us negative on the euro
EUR/USD Strategy: Like the long side while above 1.0960
| Instrument | Support 2 | Support 1 | Spot | Resistance 1 | Resistance 2 |
|---|---|---|---|---|---|
| EUR/USD | *1.0960 | 1.1070 | 1.1170 | 1.1195 | *1.1250 |
Price & Time Analysis: S&P 500

Charts Created using Marketscope – Prepared by Kristian Kerr
- S&P 500 failed near the 127% extension of the December-January range during the cycle turn window at the beginning of the week
- Our near-term trend bias is higher in the index while above 2090
- Traction above 2125 is needed to set off another leg higher in the index
- A minor turn window is eyed tomorrow
- A daily close below 2090 would turn us negative on the S&P 500
S&P 500 Strategy: Square, may look to go short on a move under 2090.
| Instrument | Support 2 | Support 1 | Spot | Resistance 1 | Resistance 2 |
|---|---|---|---|---|---|
| S&P 500 | 2070 | *2080 | 2100 | 2108 | *2125 |
Focus Chart of the Day: NZD/USD

Some interesting action in NZD/USD over the past few days as a set of trendlines continue to have a clear influence on spot. On the topside the line connecting the October and January highs comes into play around .7700 and has proven formidable resistance over the past couple of weeks with various attempts higher stalling out there on a closing basis. The lower trendline just under .7600 connects the March and mid-April lows and has proven to be a solid support these past few days. With these lines inching closer to each other by the day we can only assume this impasse in price will break shortly. Given yesterday’s reversal occurred during a cycle turn window and the fact that the price action over the past few weeks has set up a pretty clear potential double top we slightly favor a downside resolution. A close under .7590 or a break of the pattern trigger at .7540 would signal that that a move lower of some importance is underway. A close over .7700 is needed to invalidate the negative cyclicality and set the stage for a more important push higher in the Bird.
To receive Kristian’s analysis directly via email, please SIGN UP HERE.
--- Written by Kristian Kerr, Senior Currency Strategist for DailyFX.com
This publication attempts to further explore the concept that mass movements of human psychology, as represented by the financial markets, are subject to the mathematical laws of nature and through the use of various geometric, arithmetic, statistical and cyclical techniques a better understanding of markets and their corresponding movements can be achieved.
To contact Kristian, e-mail instructor@dailyfx.com. Follow me on Twitter @KKerrFX


