


Talking Points
-We are still anticipating another bounce higher of similar size to the Feb 11-Feb 18 up trend
-Dow Jones rallies to channel resistance after dropping into 16,410-16,500 support zone
-Below 15,500 invalidates the near term bullish bias
Dow Jones Industrial Average finished yesterday near its lows for the day. From a technical perspective, the 50 Day Simple Moving Average drives through the levels we saw at yesterday’s lows. Therefore, the probability of a bounce higher is increased. We are still anticipating another bounce higher of similar size and magnitude relative to the February 11 – February 18 up trend. This places a target zone in 17,000-17,300.
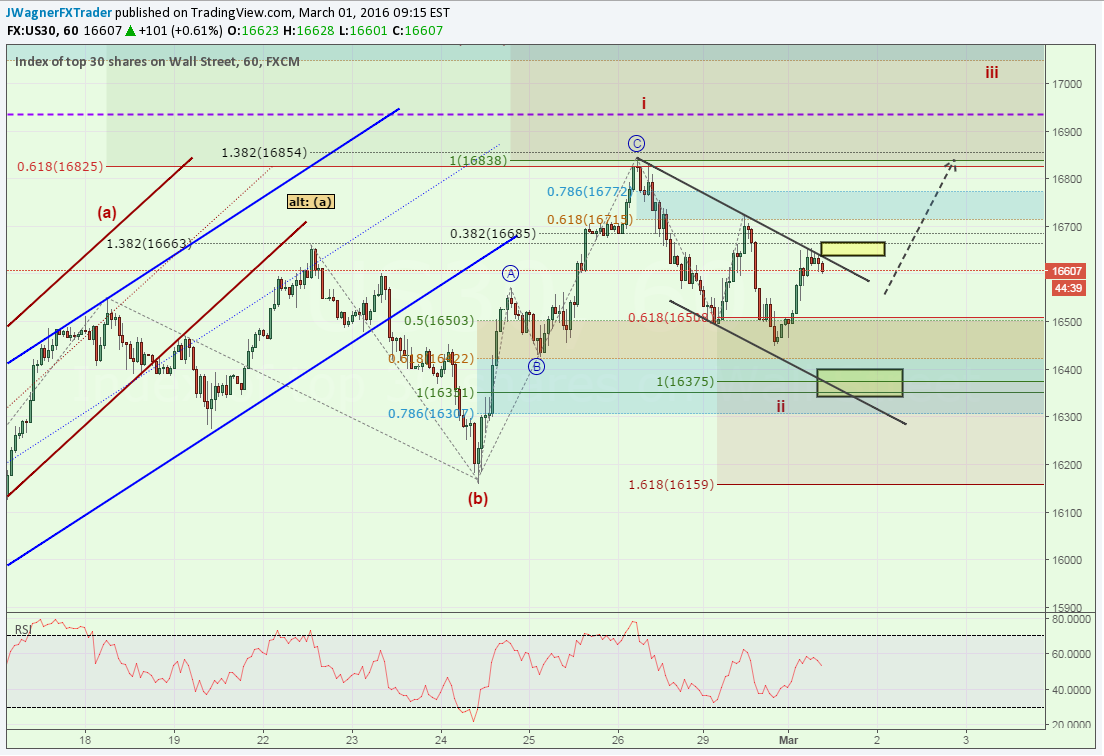
Dow Jones (ticker: US30) Pressuring Channel Resistance
[Image 1]
As we look ahead to today, the patterns mentioned in yesterday’s report for the US30, a CFD which tracks the Dow Jones Industrial Average, remain viable. The price action from yesterday does provide some more clarity to the near term pattern as the Dow Jones is stuck in a sideways consolidation after dropping to a low of 16,450, which was in the 16,410-16,500 zone cited yesterday.
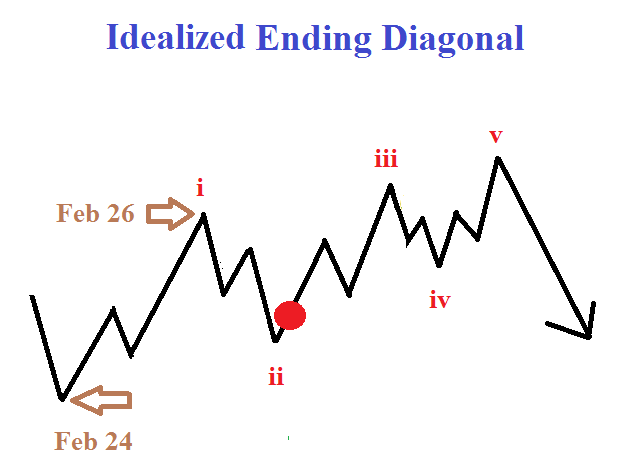
A break above 16,660 does punch prices above the downward sloping channel formed from the February 26 high. If this break occurs today, it would be symptomatic of the diagonal pattern introduced yesterday and the 16,450 low was the end of wave ii of the diagonal (see image 2 below)
[Image 2 – Idealized Ending Diagonal Pattern]
The inability to break 16,600 today suggests prices are still subdividing lower and may work down towards 16,350-16,400 and possibly lower levels near 16,000. Once support is found, prices likely begin a rally under the pattern’s interpretation.
As a result, a trader can look to buy a break above 16,660 or wait to buy the dip for intraday trades.
If for some reason, prices break down below the February 11 low of 15,500, then the premise of this analysis is incorrect and we will look to assess other alternative patterns at play.
Each year, the DailyFX team publishes their top trading opportunities guide and this year included some commentary regarding trading the stock market. Grab the 2016 Top Trading Opportunities Guide and receive the Q1 Equities forecast as well.
Related Reading:
US Indices: S&P 500 Short-term Chart in Focus
Dow Futures Push Into Support Setting Up DJIA Bullish Reversal
---Written by Jeremy Wagner, Head Trading Instructor, DailyFX EDU
Follow me on Twitter at @JWagnerFXTrader .
See Jeremy’s recent articles at his Bio Page.
To receive additional articles from Jeremy via email, join Jeremy’s distribution list.
Experience no stop or limit trading restriction on US30 trades. Learn more here, then try out a demo account (non-US residents only).


