


Talking Points
-Bullish hammer candle pattern on the daily chart yesterday suggests the near term trend is up
-Near term bullish traders may find support in the 16,300-16,400 zone
-Below 15,500 invalidates the near term bullish bias
Dow futures traded a little higher overnight on the heels of a bullish reversal for the Dow Jones Industrial Average. The US30, a CFD which tracks the Dow Jones Industrial Average, finished yesterday on a high note after an initial sell off that pulled the index down to new weekly lows. On a daily basis, this is a bullish candle formation that suggests additional gain are on the horizon.
Our assessment of the waves suggest that a case is being built to look for near term dips to be bought while targeting 17,000-17,350.
DJIA (ticker: US30) Near Term Uptrend
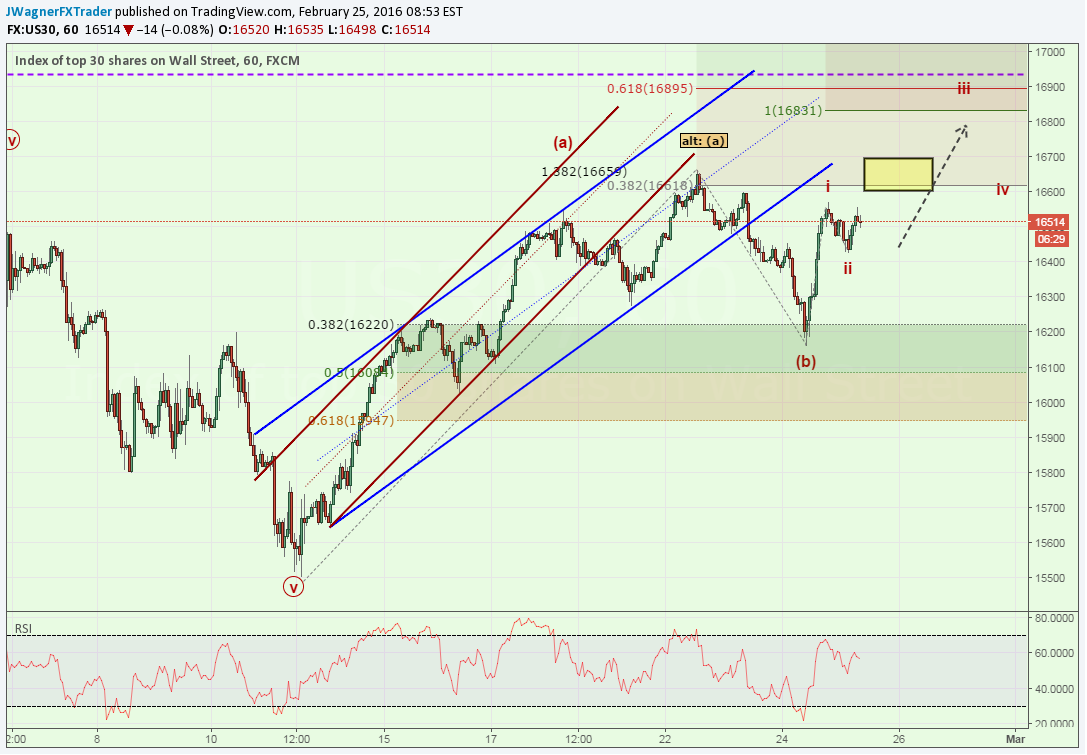
Zooming into an intraday chart and implementing Elliott Wave technical analysis, we can see that the February 11 low to last week’s high appears to have carved out in 5 waves. That entire move is labeled as (a) on the chart above.
We know from Elliott wave theory that a 5 wave move to begin a trend must be followed up with another 5 wave move of similar magnitude. That suggests we’ll likely see 17,000-17,350 over the coming days.
The US30 has some congestion resistance between now and 16,663. If the 16,663 level breaks, then price action around 16,831 will help clear up the near term pattern and we can begin to dial in targets for remainder of the move.
However, we don’t know if prices will immediately continue higher or not. If prices are resisted and fall, 16,300-16,400 might offer some support. If that fails, then yesterday’s low near 16,160 may act like a magnet to possibly provide the next level of support.
If for some reason prices break down below the February 11 low of 15,500, then the premise of this analysis is incorrect and we will look to assess other alternative patterns at play.
---Written by Jeremy Wagner, Head Trading Instructor, DailyFX EDU
Follow me on Twitter at @JWagnerFXTrader .
See Jeremy’s recent articles at his Bio Page.
To receive additional articles from Jeremy via email, join Jeremy’s distribution list.
Experience no stop or limit trading restriction on US30 trades. Learn more here and then try out a demo account (non-US residents only).


