


To receive James Stanley’s Analysis directly via email, please sign up here.
Talking Points:
- Gold Technical Strategy: Flat, conditional setups identified
- Gold has continued to break above resistance levels as a weak-USD has permeated throughout markets.
- Traders can look to the 4-month-high to define trading strategy moving forward. Breaks above are bullish, until then, this is resistance for potential stop placement on short-positions.
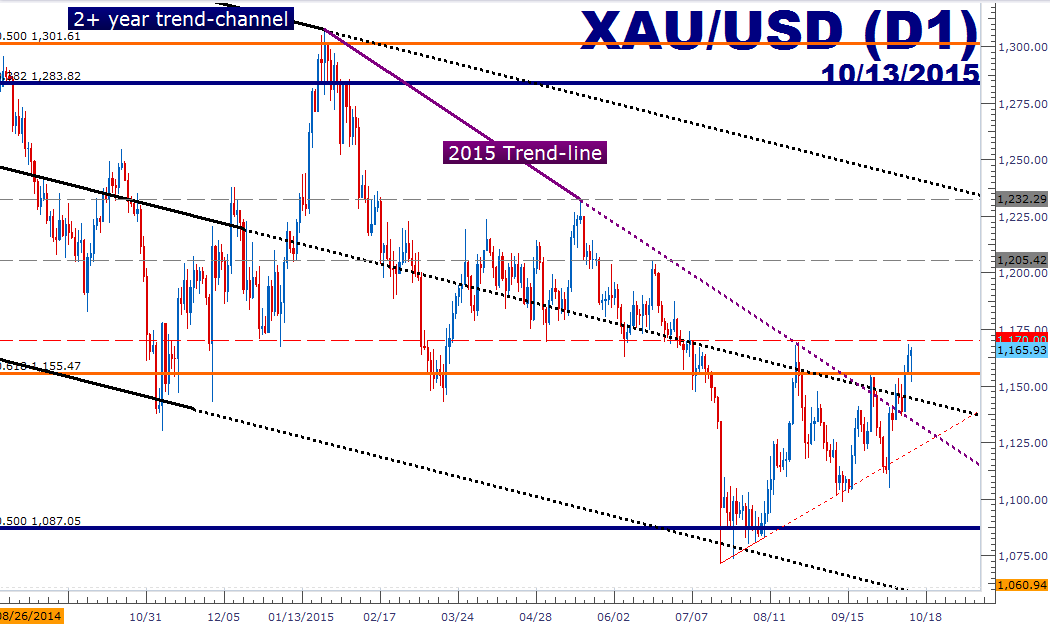
In our last piece, we looked at the 2015 trend-line that had offered near-term resistance on Gold. This trend-line can be seen on your chart by connecting the January 2015 high to the May 2015 high, and the inflection from August 24th could serve as validation of this trend-line as this was the third touch. But as markets have continued rallying with a ‘risk-on’ tone, this has brought prices in Gold higher as investors are pricing out that first rate hike from the Fed in nine years even further and further into the future.
This has brought in another familiar level in Gold, the $1,170 neighborhood which had given us the high during the risk-aversion run during China’s Black Monday. This level can be seen as a ‘line-in-the-sand’ that can help to define the trader’s strategy in the Gold market right now.
The near-term setup is to the short-side, but given the strength seen over the past few weeks, traders would likely want to wait for confirmation of this fact before jumping into the position. Should this resistance hold, traders can look to go short with stops above $1,170, and targets cast towards $1,155 (the 61.8% Fibonacci retracement of the ‘secondary move’ in Gold, taking the 2008 low to the 2011 high), $1,150 (major psychological level), $1,125 (prior price action swing low and a minor psychological level), followed by $1,100 (major psychological level) and $1,087.50 (50% Fibonacci retracement of the ‘big picture move,’ taking the 1999 low to the 2011 high).
On the bullish side, traders would likely want to wait for a break above $1,170 before planning around long positions. Should $1,170 give way, traders can look to cast targets on long positions to $1,200 (major psychological level), $1,205 (prior price action swing high), $1,232 (prior swing high), followed by $1,250 (major psychological level).
(click below for larger image)
--- Written by James Stanley, Analyst for DailyFX.com
To receive James Stanley’s analysis directly via email, please SIGN UP HERE
Contact and follow James on Twitter: @JStanleyFX


