To receive Tyler’s analysis directly via email, please SIGN UP HERE
Talking Points:
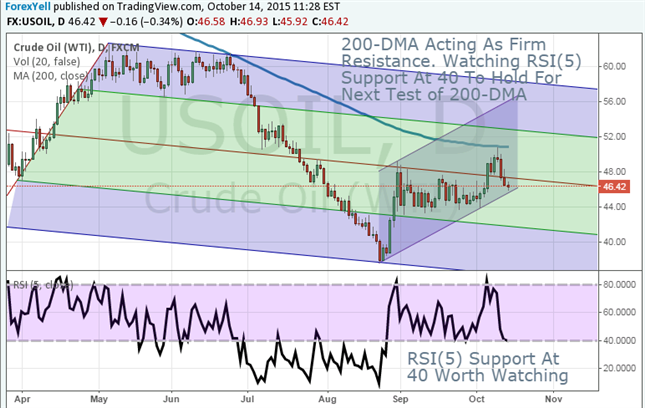
- Crude Oil Technical Strategy: Setting Up For Breakout
- WTI / Crude Oil Holding RSI(5) Support at 40 Into Support
- Support (Daily Close Basis) Focus $45.65-$46.15
The recent drop in WTI Crude Oil price away from 2 ½ month highs has some price bulls worried, but the price action is setting up for what could be an aggressive move higher. Looking to the impact of a weaker dollar and building momentum as seen via the Relative Strength Index (RSI), opens up a more bullish picture. First, the inverse correlation of the US dollar as USD weakens could see Oil strengthen above its recent pivot at $50.90 on further USD weakness. Secondly, oversold momentum unwinding could also see a clean push higher.
The Daily crude oil chart is looking as constructive to the upside as it has in a while. The $46 - $42 /bbl price floor could be seen as long-term support, even though a short break was seen towards the end of August. A further respect of this $46 - $42 /bbl zone could cause the late August move to $37 to be seen as a false break preceding an aggressive move higher. Technically, trend line support off the August 24 low and high or low on October 2 will now be in focus. Respect of this trendline turns attention to channel resistance in the mid $50s. Trendline support also aligns with the weekly S1 level that often acts as support in a budding uptrend.
RSI is a helpful tool, with specific characteristics at different trend stages. One characteristic that is unusually helpful is looking for support floors in an uptrend and resistance ceilings in a downtrend on the oscillator. One common support for is the 40 level on RSI, which the daily US oil chart has been above since late August. If we have put in a bearish momentum floor, the next move could be aggressively higher. Going forward, it is worth noting that USDollar direction will likely be critical in the path for Oil in addition to other assets. T.Y.
Add these technical levels directly to your charts with our Support/Resistance Wizard app