To receive James Stanley’s analysis directly via email, please SIGN UP HERE
Talking Points:
- S&P 500 Technical Strategy: Flat
- S&P 500 has continued moving higher after the Morning Star formation completed on Wednesday of last week.
- Near-term direction remains congested as long as the 2021 swing-high hold.
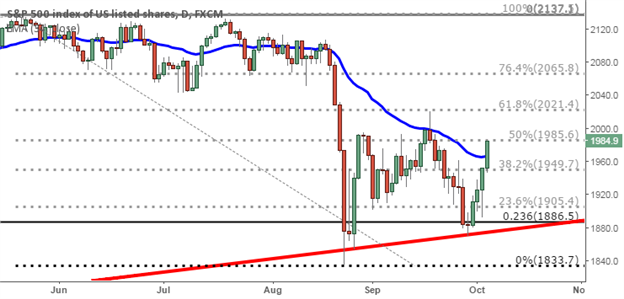
In our last piece, we looked at the long-term trend-line on the under-side of the S&P 500 that was fast approaching as prices were continuing to fall through support levels as risk-aversion swept the globe. Since then, the S&P has continued trading higher after the trend-line bounce on Tuesday of last week, and price action is showing no signs of slowing down as resistance is now shattering just as quickly as support was giving way last week.
At the core of the issue is the expectation around rate hikes from the Federal Reserve. Going into last week, we had fresh assurances from various FOMC members that a rate hike in 2015 was still very much on the table; but as we got deeper into last week, this prospect looked less-and-less likely. On Friday, an abysmal NFP report that offered very little to be positive about on the data front decreased these rate-hike odds even further. But something peculiar happened on Friday morning: After setting a low at 1,892 twenty minutes after the open of trading in the United States, the S&P 500 started trending higher and hasn’t stopped. As of this writing, we’re 90 handles off of the lows in what can best be described as a ‘relief rally.’ After the Fed held steady in the face of numerous global headwinds, electing not to hike but remaining hawkish in their stance towards future rate hikes, investors had little reason to utilize that ‘buy the dip’ logic that kept equity markets trending higher since the Financial Collapse. At this point, the simple prospect of continued ‘extraordinary accommodation’ is proving enough to propel stock markets around-the-world higher.
For the long setups mentioned in our last article, all three profit objectives have been cleared after the 1,949 resistance level was taken out. Long positions moving forward have the daunting prospect of setting risk-management levels after an outsized-move from Tuesday of last week; as the most recent swing-low on the daily chart is all the way down to 1,870. That would require approximately 120 handles of risk, which would spell a profit target north of 2,100 to get a 1-to-1 risk-to-reward ratio. One alternative for long positions could be using a shorter-term, intra-day support at the 1,949 level. This is the 38.2% Fibonacci retracement of the most recent major move, taking the high of 2137 to the ‘panic lows’ of August 24th. Setting a stop below this level would open the door for profit targets at 2,021, which is 61.8% of the most recent major move, as well as being a critical swing-high that set the top during the September FOMC announcement. The next level of resistance after 2,021 clears is at 2,065, which is the 76.4% retracement of the most recent major move.
On the short side, potential resistance at that same 1,985 area could open the door for reversal plays. Given the veracity of the strength that we’re seeing, it’d likely be advised to wait for resistance to form before triggering the reversal. The 2,000 level could also offer resistance on the S&P, as this is a ‘major psychological level’ as well as being a level that had given numerous iterations of resistance (on the way up) and support (on the way down); and could likely be a key level moving forward.
The first target for short positions is that 1,949 level, which opens the door for 1,905 (23.6% Fib retracement of the most recent major move), 1,900 (‘minor psychological level’), 1,886 (23.6% retracement of the secondary move – 2011 low to the 2015 high), and then 1,870 (price action swing-low).
Should this up-ward sloping trend-line finally give way, significantly larger targets could be in sight on the short-side of the S&P as this trend-line has held price action for nearly six-and-a-half years.