To receive James Stanley’s analysis directly via email, please SIGN UP HERE
Talking Points:
- S&P 500 Technical Strategy: Flat
- S&P 500 continues to congest as the long-awaited FOMC announcement nears.
- Standing aside until a more-confirmed short-setup becomes clear.
The S&P 500 continues to congest as the economic world inches closer to that long-awaited September Fed meeting. After the sharp recovery in equity prices two weeks ago, the S&P has been working on higher-lows on the daily chart; but curiously any extended move has had a tendency to bring sellers into the mix as indicated by top-side wicks on numerous daily candles.
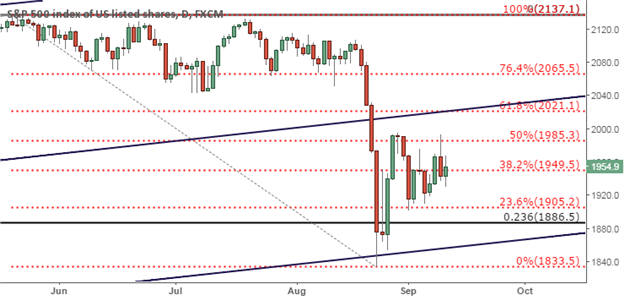
Yesterday’s price action was particularly interesting, as a pre-session gain was quickly reversed into a loss, highlighting an extended resistance wick on the daily chart at the 50% Fibonacci retracement of the most recent major move (2137 top to the ‘panic low’ on 8/24/2015). This also provides a ‘lower-high’ below the 8/28 hanging man formation that faltered short of the 2,000 psychological level. All of this could be conducive for short positions, but the primary drawback is the lack of any concerted decline since the low was set on August 24th. Recent price action has exhibited enough congestion to alert caution, as it appears as though other drivers (China, FOMC) would be the likely source of any future weakness.
Current resistance levels are at 1985, 2000, and then 2,021 (projected trend-line and 61.8% Fibonacci retracement). Current support levels can be seen at 1950, 1905 and then 1886.