


Talking Points:
- US Dollar Continues to Push Upward, Setting Monthly High
- S&P 500 Declines to Challenge Two-Month Uptrend Support
- Gold Drops Below $1200/oz, Crude Oil Back at Range Floor
Can’t access the Dow Jones FXCM US Dollar Index? Try the USD basket on Mirror Trader. **
US DOLLAR TECHNICAL ANALYSIS – Prices re-accelerated upward, advancing to the highest level in a month. Near-term resistance is at 11960, the 61.8% Fibonacci retracement, with a break above that on a daily closing basis exposing the 76.4% level at 12037. Alternatively, a turn back below the 50% Fib at 11898 clears the way for a test of the 38.2% retracement at 11836.
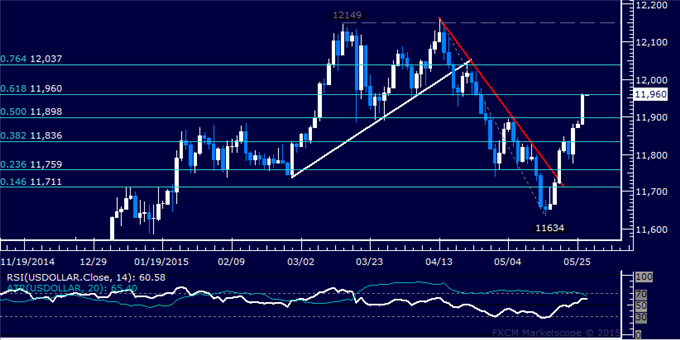
Daily Chart - Created Using FXCM Marketscope
** The Dow Jones FXCM US Dollar Index and the Mirror Trader USD basket are not the same product.
S&P 500 TECHNICAL ANALYSIS – Prices turned sharply lower, moving to challenge the rising trend in place since mid-March. A daily close below the 38.2% Fibonacci retracement at 2100.00 exposes the 50% level at 2088.60. Alternatively, a move above the 23.6% Fib at 2114.20 targets the 14.6% retracement at 2122.90.
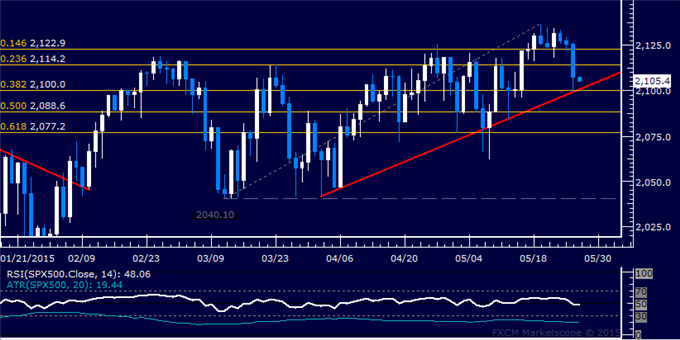
Daily Chart - Created Using FXCM Marketscope
GOLD TECHNICAL ANALYSIS – Prices accelerated downward anew, with sellers claiming a foothold below the $1200/oz figure. A close below range support at 1178.09 exposes the 38.2% Fibonacci expansion at 1169.31. Alternatively, a rebound above the 23.6% level at 1193.38 targets trend line support-turned-resistance at 1204.98.
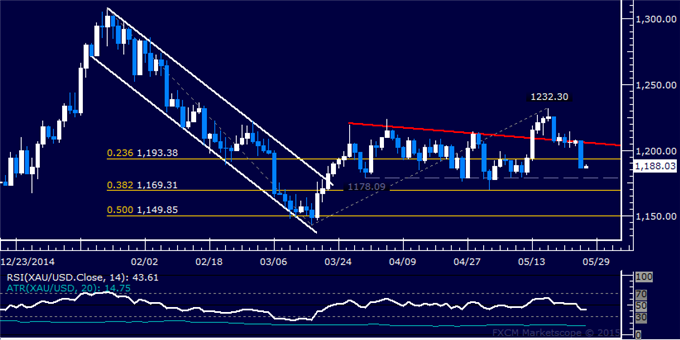
Daily Chart - Created Using FXCM Marketscope
CRUDE OIL TECHNICAL ANALYSIS – Prices remain locked in a choppy consolidation range below the $70/barrel figure. A daily close below the 23.6% Fibonacci retracement exposes the 38.2% level at 60.27. Alternatively, a move above trend line resistance at 66.40 targets the May 6 high at 69.60.
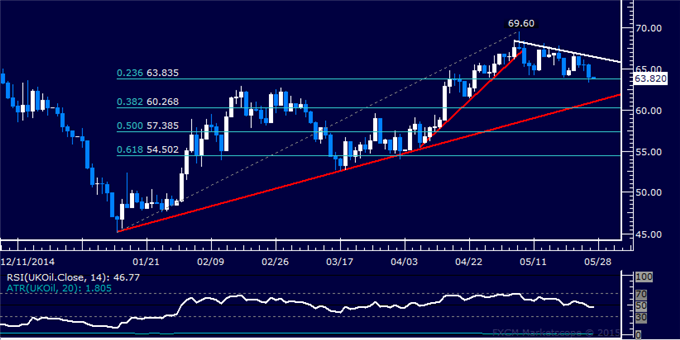
Daily Chart - Created Using FXCM Marketscope
--- Written by Ilya Spivak, Currency Strategist for DailyFX.com
To receive Ilya's analysis directly via email, please SIGN UP HERE
Contact and follow Ilya on Twitter: @IlyaSpivak


