


Talking Points:
- US Dollar Extends Recovery for Fourth Consecutive Day
- S&P 500 Digesting Gains After Setting New Record High
- Gold, Crude Oil Prices Stall After Suffering Large Losses
Can’t access the Dow Jones FXCM US Dollar Index? Try the USD basket on Mirror Trader. **
US DOLLAR TECHNICAL ANALYSIS – Prices advanced for a fourth consecutive day but failed to clear a near-term upside chart barrier. Near-term resistance is at 11836, the 38.2% Fibonacci retracement, with a break above that on a daily closing basis exposing the 50% level at 11898. Alternatively, a turn back below the 11748-59 area (range support, 23.6% Fib) clears the way for a test of the 14.6% retracement at 11711.
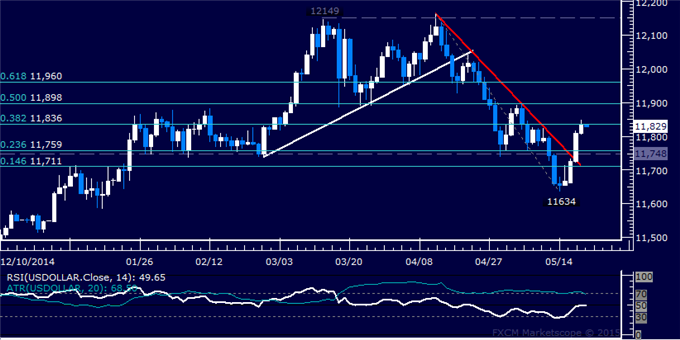
Daily Chart - Created Using FXCM Marketscope
** The Dow Jones FXCM US Dollar Index and the Mirror Trader USD basket are not the same product.
S&P 500 TECHNICAL ANALYSIS – Prices are consolidating after breaking range resistance and setting a new record high. From here, a daily close above the 50% Fibonacci expansion at 2140.70 exposes the 61.8% level at 2159.30. Alternatively, a move back below the 38.2% Fib at 2122.10 targets the 23.6% expansion at 2099.10.
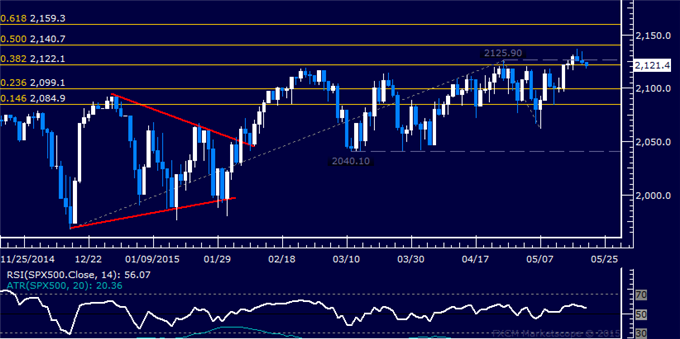
Daily Chart - Created Using FXCM Marketscope
GOLD TECHNICAL ANALYSIS – Prices are consolidating after issuing the largest daily decline in three weeks. A close below trend line resistance-turned-support at 1206.69 exposes the 23.6% Fibonacci expansion at 1193.38. Near-term resistance is at 1232.30, the May 18 high.
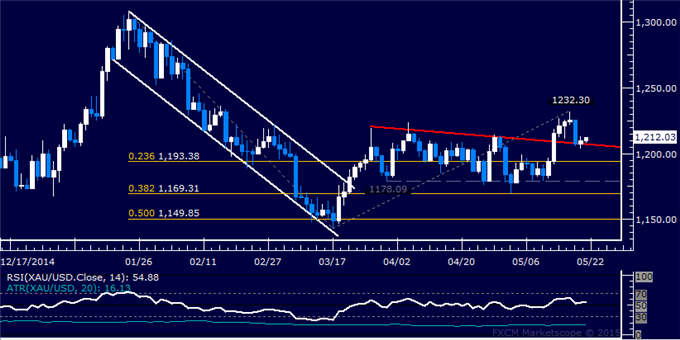
Daily Chart - Created Using FXCM Marketscope
CRUDE OIL TECHNICAL ANALYSIS – Prices are digesting losses after issuing the largest decline in six weeks. From here, a daily close below the 23.6% Fibonacci retracement exposes the 38.2% level at 60.27. Alternatively, a move above the 14.6% retracement at 66.03 targets the 14.6% Fib expansion at 67.78.
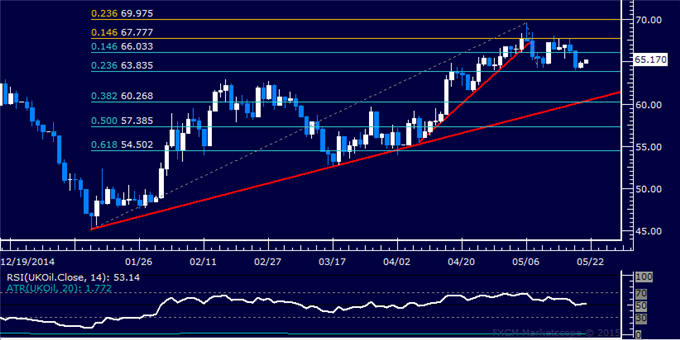
Daily Chart - Created Using FXCM Marketscope
--- Written by Ilya Spivak, Currency Strategist for DailyFX.com
To receive Ilya's analysis directly via email, please SIGN UP HERE
Contact and follow Ilya on Twitter: @IlyaSpivak


