


Talking Points:
- US Dollar Consolidating After Sinking to Lowest in 4 Months
- S&P 500 Continues to Oscillate in a Choppy Trading Range
- Crude Oil in Digestion Mode, Gold Spikes to 3-Month High
Can’t access the Dow Jones FXCM US Dollar Index? Try the USD basket on Mirror Trader. **
US DOLLAR TECHNICAL ANALYSIS – Prices paused to consolidate losses after dropping to the weakest level in four months. Near-term support is at 11638, the 61.8% Fibonacci expansion, with a break below that on a daily closing basis exposing the 76.4% level at 11576. Alternatively, a turn above the 50% Fib at 11688 clears the way for a test of the 38.2% threshold at 11737.
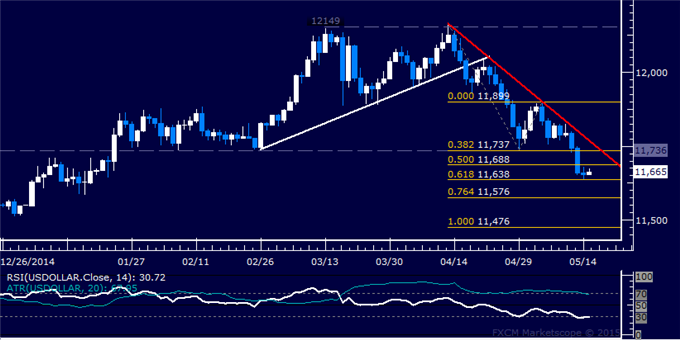
Daily Chart - Created Using FXCM Marketscope
** The Dow Jones FXCM US Dollar Index and the Mirror Trader USD basket are not the same product.
S&P 500 TECHNICAL ANALYSIS – Prices continue to jostle around in a choppy range, waiting for clear-cut direction cues. A daily close above the 38.2% Fibonacci expansion at 2122.10 exposes the 50% level at 2140.70. Alternatively, a reversal below the 23.6% Fib at 2099.10 targets the 14.6% expansion at 2084.90.

Daily Chart - Created Using FXCM Marketscope
GOLD TECHNICAL ANALYSIS – Prices are attempting to build higher anew. A break above the 76.4% Fibonacci expansion at 1231.71 exposes the 100% level at 1250.96. Alternatively, a turn below the 61.8% Fib at 1219.80 targets the 50% expansion at 1210.18.

Daily Chart - Created Using FXCM Marketscope
CRUDE OIL TECHNICAL ANALYSIS – Prices are attempting to build higher anew having found support above the $64.00 figure. A daily close above the 23.6% Fibonacci expansion at 68.23 exposes the May 6 high at 69.60, followed by the 38.2% level at 70.72. Alternatively, a turn below the 14.6% Fib retracement at 66.03 targets the 23.6% threshold at 63.84.

Daily Chart - Created Using FXCM Marketscope
--- Written by Ilya Spivak, Currency Strategist for DailyFX.com
To receive Ilya's analysis directly via email, please SIGN UP HERE
Contact and follow Ilya on Twitter: @IlyaSpivak


