


Talking Points:
- US Dollar Snaps Three-Day Win Streak, Returns to the Defensive
- S&P 500 Rejected at Resistance, Bolstering Double Top Scenario
- Gold Stuck in Familiar Range, Crude Oil Rises to 5-Month High
Can’t access the Dow Jones FXCM US Dollar Index? Try the USD basket on Mirror Trader. **
US DOLLAR TECHNICAL ANALYSIS – Prices are under pressure once again having rebounded as expected after showing a bullish Piercing Line candle pattern. Near-term support is at 11837, the 14.6% Fibonacci expansion, with a break below that on a daily closing basis exposing the 23.6% level at 11799. Alternatively, a move above the 38.2% Fib retracement at 11901 clears the way for a test of the 50% threshold at 11951.
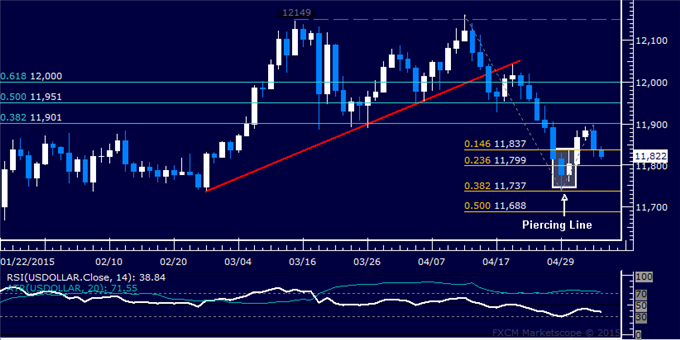
Daily Chart - Created Using FXCM Marketscope
** The Dow Jones FXCM US Dollar Index and the Mirror Trader USD basket are not the same product.
S&P 500 TECHNICAL ANALYSIS – Prices are waiting for downside follow-through after putting in a Bearish Engulfing candlestick pattern, warning that a double top may yet be confirmed at 2119.40 (February 25 high). A break below the 14.6% Fibonacci retracement at 2081.10 exposes the 23.6% level at 2053.40. Alternatively, a move back above 2119.40 targets the 23.6% Fib expansion at 2149.10.
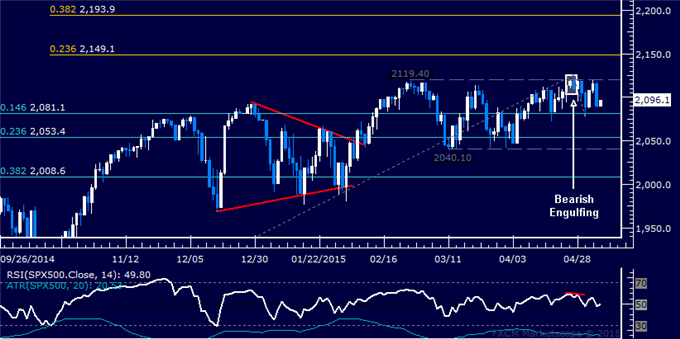
Daily Chart - Created Using FXCM Marketscope
GOLD TECHNICAL ANALYSIS – Prices are cautiously probing higher after finding support at a familiar range floor above $1175/oz once again. From here, a push above the 38.2% Fibonacci expansion at 1196.26 exposes the 23.6% level at 1203.42. Alternatively, a move below the 50% Fib at 1190.47 targets the 61.8% Fib at 1184.69.
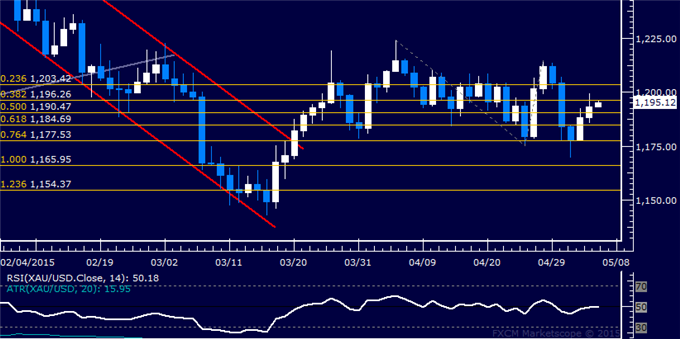
Daily Chart - Created Using FXCM Marketscope
CRUDE OIL TECHNICAL ANALYSIS – Prices continue to push higher, testing the strongest levels in five months. A break above the 61.8% Fibonacci expansion at 69.01 exposes the 76.4% level at 70.81. Alternatively, a move below the 50% Fib at 67.55 targets the 38.2% expansion at 66.09.
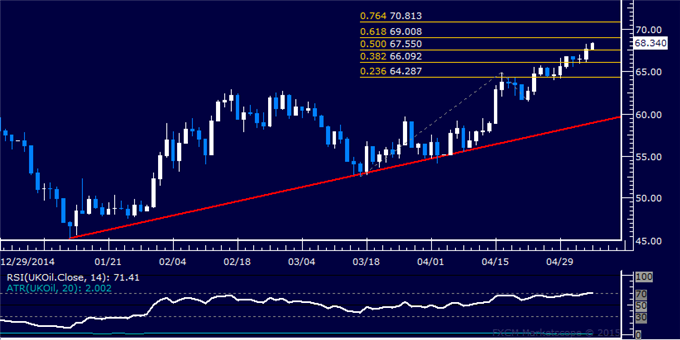
Daily Chart - Created Using FXCM Marketscope
--- Written by Ilya Spivak, Currency Strategist for DailyFX.com
To receive Ilya's analysis directly via email, please SIGN UP HERE
Contact and follow Ilya on Twitter: @IlyaSpivak


