


Talking Points:
- US Dollar Positioning Hints Prices May Return to the Offensive
- S&P 500 Struggling to Make Good on Bearish Reversal Setup
- Crude Oil Consolidating, Gold Bounces from Familiar Support
Can’t access the Dow Jones FXCM US Dollar Index? Try the USD basket on Mirror Trader. **
US DOLLAR TECHNICAL ANALYSIS – Prices turned higher as expected after producing a bullish Piercing Line candle pattern. A daily close above the 38.2% Fibonacci retracement at 11901 exposes the 50% level at 11951. Alternatively, a reversal below the 23.6% level at 11839 opens the door for a challenge of the 14.6% Fib at 11801.
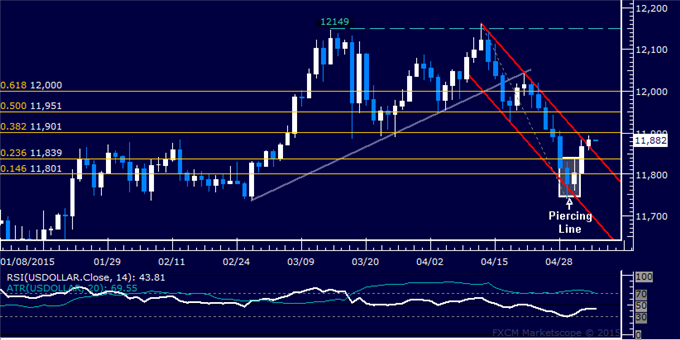
Daily Chart - Created Using FXCM Marketscope
** The Dow Jones FXCM US Dollar Index and the Mirror Trader USD basket are not the same product.
S&P 500 TECHNICAL ANALYSIS – Prices are struggling to maintain downward momentum after putting in a Bearish Engulfing candlestick pattern but the setup remains technically valid for now, warning that a double top may yet be confirmed at 2119.40 (February 25 high). A break below the 14.6% Fibonacci retracement at 2081.10 exposes the 23.6% level at 2053.40. Alternatively, a move back above 2119.40 targets the 23.6% Fib expansion at 2149.10.
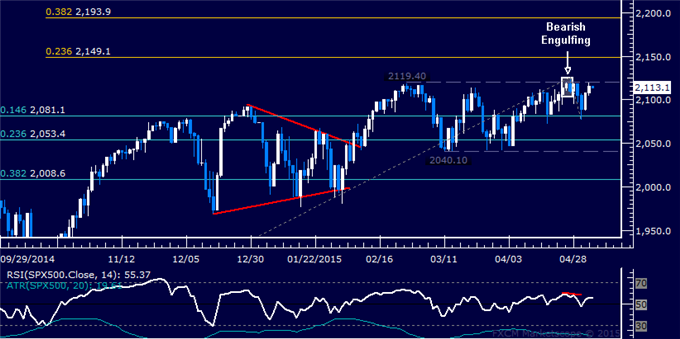
Daily Chart - Created Using FXCM Marketscope
GOLD TECHNICAL ANALYSIS – Prices found support at a familiar range floor above $1175/oz once again. From here a push above the 50% Fibonacci expansion at 1190.47 exposes the 38.2% level at 1196.26. Alternatively, a move below the 61.8% Fib at 1184.69 targets the 76.4% Fib at 1177.53.
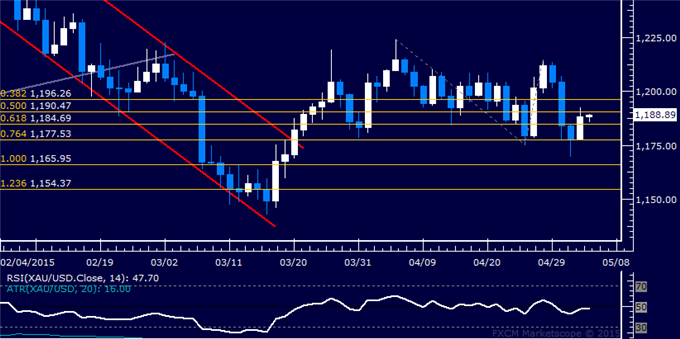
Daily Chart - Created Using FXCM Marketscope
CRUDE OIL TECHNICAL ANALYSIS – Prices are digesting gains after rising to the highest level in five months. A break above the 50% Fibonacci expansion at 67.55 exposes the 61.8% level at 69.01. Alternatively, a move below the 38.2% Fib at 66.09 targets the 23.6% expansion at 64.29.
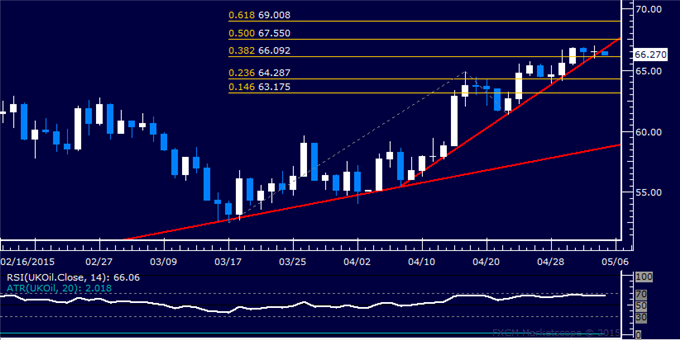
Daily Chart - Created Using FXCM Marketscope
--- Written by Ilya Spivak, Currency Strategist for DailyFX.com
To receive Ilya's analysis directly via email, please SIGN UP HERE
Contact and follow Ilya on Twitter: @IlyaSpivak


