


Talking Points:
- US Dollar Stalls at Former Support After Corrective Recovery
- S&P 500 Continues to Tread Water Below Familiar Range Top
- Gold May Be Topping, Crude Oil Declines Most in Two Weeks
Can’t access the Dow Jones FXCM US Dollar Index? Try the USD basket on Mirror Trader. **
US DOLLAR TECHNICAL ANALYSIS – Prices stalled on a retest of a pivotal trend line after correcting upward from a monthly low. Near-term resistance is in the 12027-49 area (23.6% Fibonacci expansion, trend line), with a break above that on a daily closing basis exposing the 38.2% level at 12089. Alternatively, a turn below the 14.6% expansion at 11989 clears the way for a test of the 50% Fib retracement at 11950.
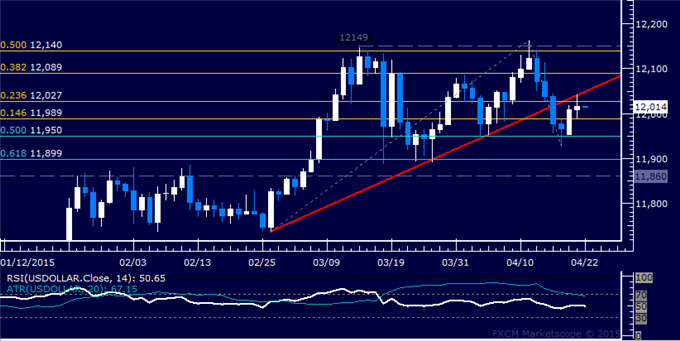
Daily Chart - Created Using FXCM Marketscope
** The Dow Jones FXCM US Dollar Index and the Mirror Trader USD basket are not the same product.
S&P 500 TECHNICAL ANALYSIS – Prices continue to hover below resistance in the 2111.00-19.40 area (23.6% Fibonacci expansion, February 25 high). A break above that on a daily closing basis exposing the 38.2% level at 2154.90. Alternatively, a reversal below the 14.6% Fib at 2084.00 targets the March 12 low at 2040.10.
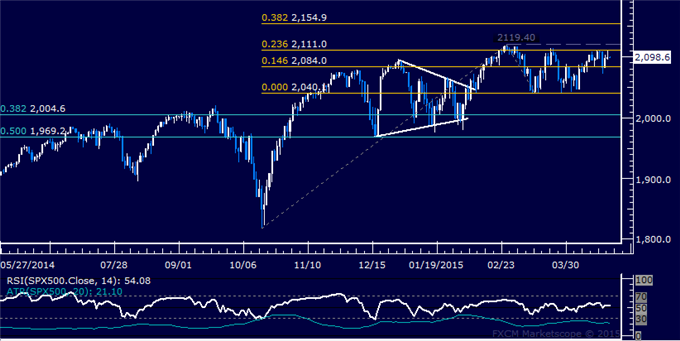
Daily Chart - Created Using FXCM Marketscope
GOLD TECHNICAL ANALYSIS – Prices may be carving out a bearish Head and Shoulders top chart pattern. Confirmation is required on a daily close below 1185.23, the 23.6% Fibonacci expansion, with the first downside target thereafter coming in the 38.2% level (1161.16). Near-term resistance is at 1224.15, the April 6 high.
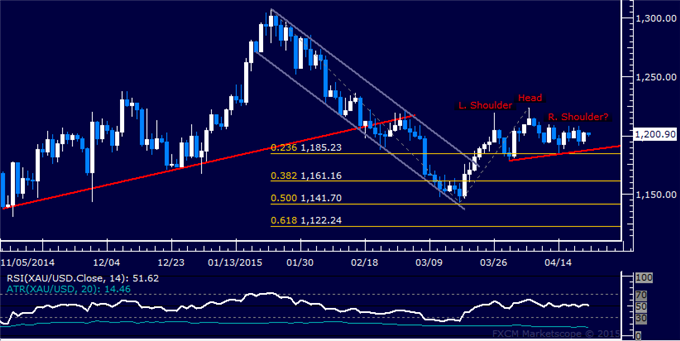
Daily Chart - Created Using FXCM Marketscope
CRUDE OIL TECHNICAL ANALYSIS – Prices turned lower anew having found resistance below the $65/barrel figure. Near-term support is at 60.25, the 23.6% Fibonacci retracement, with a break below that on a daily closing basis exposing the 38.2% level at 57.37. Alternatively, a move back above the 14.6% Fib at 62.03 targets the April 16 high at 64.91.
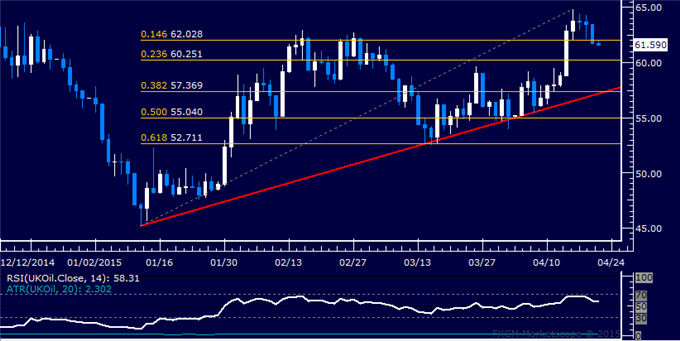
Daily Chart - Created Using FXCM Marketscope
--- Written by Ilya Spivak, Currency Strategist for DailyFX.com
To receive Ilya's analysis directly via email, please SIGN UP HERE
Contact and follow Ilya on Twitter: @IlyaSpivak


