


Talking Points:
- US Dollar Starts Making Good on Bearish Chart Cues
- S&P 500 Continues to Wait for Clarity Near March Low
- Gold Poised to Extend Gains, Crude Oil Consolidating
Can’t access the Dow Jones FXCM US Dollar Index? Try the USD basket on Mirror Trader. **
US DOLLAR TECHNICAL ANALYSIS – Prices declined as expected after putting in a bearish Evening Star candlestick pattern. Near-term support is in the 11858-86 area (March 18 low, 23.6% Fibonacci retracement), with a break below that on a daily closing basis exposing the 38.2% level at 11679. Alternatively, a turn above the 14.6% Fib expansion at 12066 clears the way for a test of the 12149-77 zone (March 13 high, 23.6% threshold).
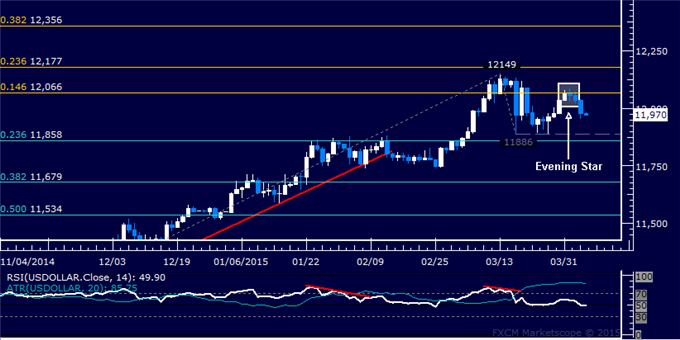
Daily Chart - Created Using FXCM Marketscope
** The Dow Jones FXCM US Dollar Index and the Mirror Trader USD basket are not the same product.
S&P 500 TECHNICAL ANALYSIS – Prices moved lower as expected after putting in a bearish Evening Star candlestick pattern. A daily close below the March 12low at 2040.10 exposes the 38.2% Fibonacci retracement at 2004.60. Alternatively, a reversal above the 14.6% Fib expansion at 2084.00 targets the 2111.00-19.40 area (23.6% threshold, February 25 high).
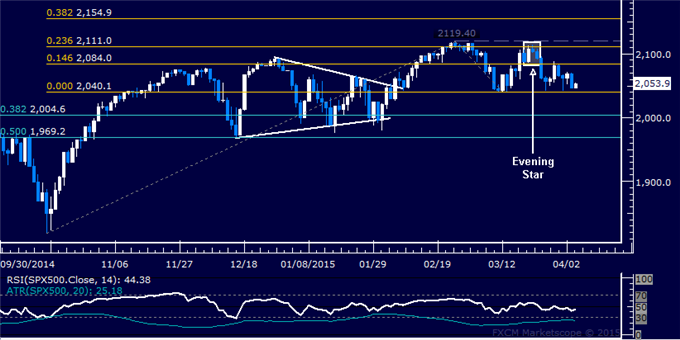
Daily Chart - Created Using FXCM Marketscope
GOLD TECHNICAL ANALYSIS – Prices look poised to continue higher after clearing resistance at 1210.35, the 38.2% Fibonacci expansion. From here, a daily close above the 50% level at 1231.28 exposes the 61.8% Fib at 1252.22. Alternatively, a reversal back below 1210.35 targets the March 31 low at 1178.38.
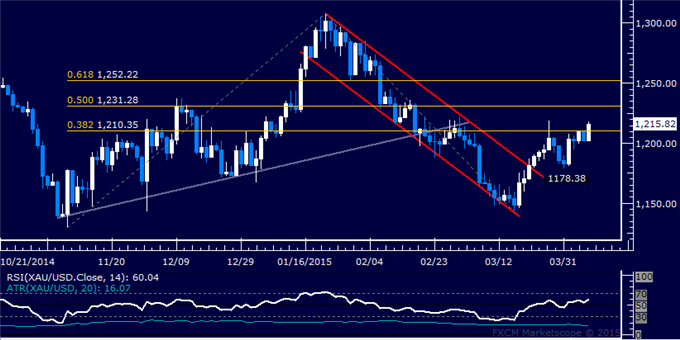
Daily Chart - Created Using FXCM Marketscope
CRUDE OIL TECHNICAL ANALYSIS – Prices continue to tread water below the $60/barrel figure. A close above the March 26 high at 59.75 exposes the February 17 top at 62.98. Alternatively, a push below the 14.6% Fibonacci expansion at 52.76 targets the 23.6% level at 46.47.
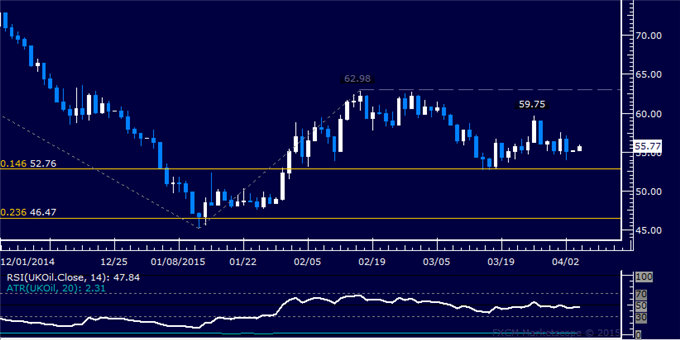
Daily Chart - Created Using FXCM Marketscope
--- Written by Ilya Spivak, Currency Strategist for DailyFX.com
To receive Ilya's analysis directly via email, please SIGN UP HERE
Contact and follow Ilya on Twitter: @IlyaSpivak


