


Talking Points:
- US Dollar Chart Positioning Warns of Weakness Ahead
- S&P 500 Treading Water Above March Swing Bottom
- Crude Oil Sees Support Below $53, Gold Bounce Stalls
Can’t access the Dow Jones FXCM US Dollar Index? Try the USD basket on Mirror Trader. **
US DOLLAR TECHNICAL ANALYSIS – Prices may be readying to turn lower after prices put in a bearish Evening Star candlestick pattern. A daily close below the 11858-86 area (March 18 low, 23.6% Fibonacci retracement) exposes the 38.2% level at 11679. Alternatively, a reversal above the 14.6% Fib expansion at 12066 opens the door for a challenge of the 12149-77 zone (March 13 high, 23.6% threshold).

Daily Chart - Created Using FXCM Marketscope
** The Dow Jones FXCM US Dollar Index and the Mirror Trader USD basket are not the same product.
S&P 500 TECHNICAL ANALYSIS – Prices moved lower as expected after putting in a bearish Evening Star candlestick pattern. A daily close below the March 12low at 2040.10 exposes the 38.2% Fibonacci retracement at 2004.60. Alternatively, a reversal above the 14.6% Fib expansion at 2084.00 targets the 2111.00-19.40 area (23.6% threshold, February 25 high).
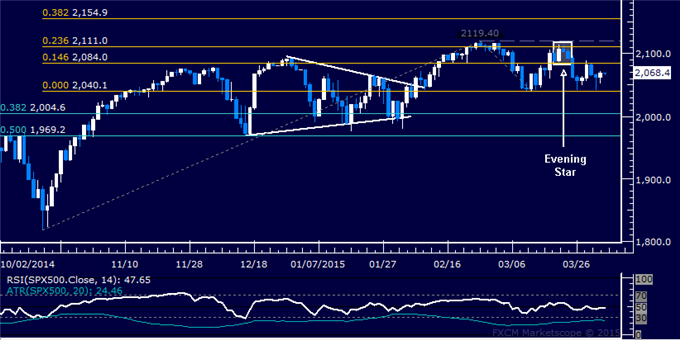
Daily Chart - Created Using FXCM Marketscope
GOLD TECHNICAL ANALYSIS – Prices recoiled sharply higher after declining as expected following the appearance of a bearish Dark Cloud Cover candlestick pattern. A daily close above the 38.2% Fibonacci retracement at 1205.58 exposes the 50% level at 1225.04. Alternatively, a push below the 23.6% Fib expansion at 1180.90 targets the 38.2% threshold at 1156.83.
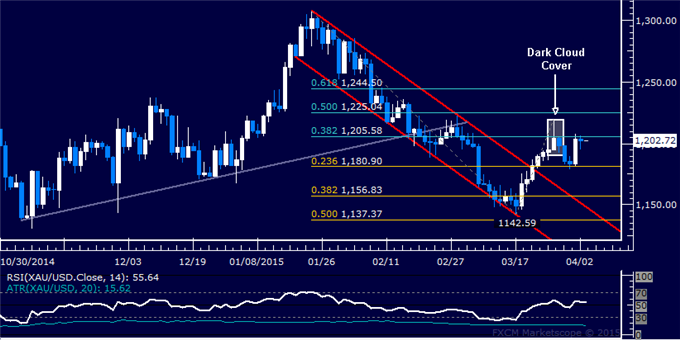
Daily Chart - Created Using FXCM Marketscope
CRUDE OIL TECHNICAL ANALYSIS – Prices continue to tread water below the $60/barrel figure. A close above the March 26 high at 59.75 exposes the February 17 top at 62.98. Alternatively, a push below the 14.6% Fibonacci expansion at 52.76 targets the 23.6% level at 46.47.
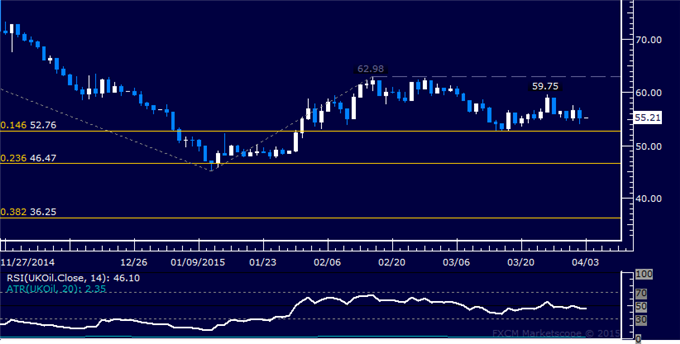
Daily Chart - Created Using FXCM Marketscope
--- Written by Ilya Spivak, Currency Strategist for DailyFX.com
To receive Ilya's analysis directly via email, please SIGN UP HERE
Contact and follow Ilya on Twitter: @IlyaSpivak


