


Talking Points:
- US Dollar Chart Setup Hints at Turn Downward Ahead
- S&P 500 Still Treading Water Near Monthly Range Top
- Gold Prices Continue Pullback, Crude Oil Flat-Lining
Can’t access the Dow Jones FXCM US Dollar Index? Try the USD basket on Mirror Trader. **
US DOLLAR TECHNICAL ANALYSIS – Prices put in a Shooting Star candlestick pattern below multi-year resistance, hinting a pullback may be ahead. A daily close below the 23.6% Fibonacci expansion at 11772 exposes the resistance-turned-support at 11715, the January 8 high. Alternatively, a push above the 11854-88 area marked by the March 2009 high and the 38.2% level opens the door for a challenge of the 50% Fib at 11983.
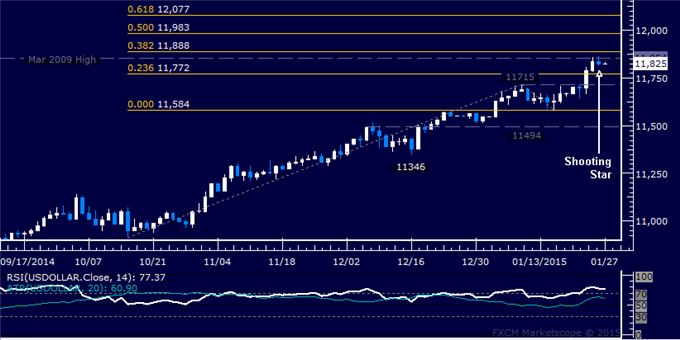
Daily Chart - Created Using FXCM Marketscope
** The Dow Jones FXCM US Dollar Index and the Mirror Trader USD basket are not the same product.
S&P 500 TECHNICAL ANALYSIS – Prices declined as expected after putting in a bearish Evening Star candlestick pattern. A daily close below the 61.8% Fibonacci expansion at 2047.50 exposes the 50% level at 2033.80. Alternatively, a turn back above the 76.4% Fib at 2064.30 aims for the December 29 high at 2092.60.
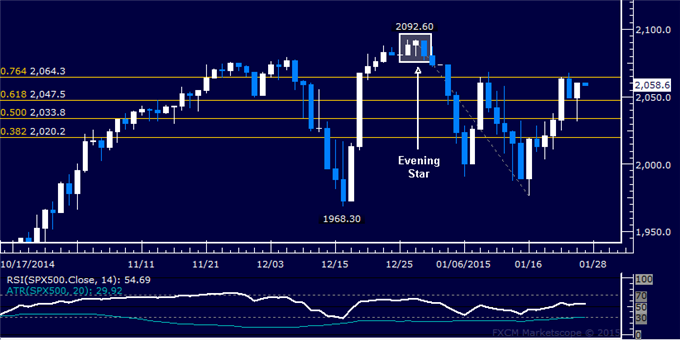
Daily Chart - Created Using FXCM Marketscope
GOLD TECHNICAL ANALYSIS – Prices fell for a second consecutive day, with sellers now testing support at 1274.30 marked by the 23.6% Fibonacci retracement. A break below this barrier on a daily closing basis exposes the 1253.77-55.20 area marked by the October 21 high and the 38.2% level. Alternatively, a reversal above the 14.6% Fib at 1286.96 targets the January 22 peak at 1307.49.
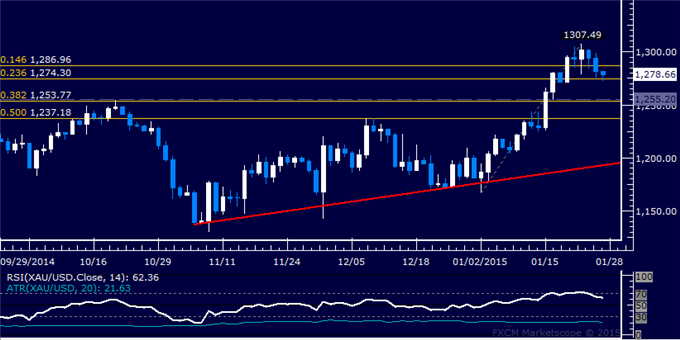
Daily Chart - Created Using FXCM Marketscope
CRUDE OIL TECHNICAL ANALYSIS – Prices are stalling having attempted to recover as expected. A daily close above the 14.6% Fibonacci retracement at 50.49 exposes the 23.6% level at 53.77. Alternatively, a reversal below the 14.6% Fib expansion at 47.07 targets the 23.6% threshold at 43.79.
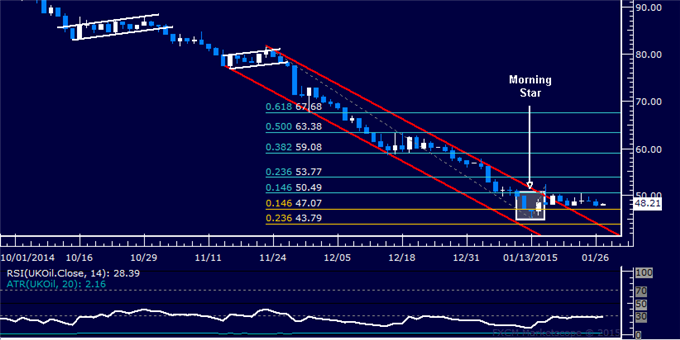
Daily Chart - Created Using FXCM Marketscope
--- Written by Ilya Spivak, Currency Strategist for DailyFX.com
To receive Ilya's analysis directly via email, please SIGN UP HERE
Contact and follow Ilya on Twitter: @IlyaSpivak


