


Summary:
- Another night of disappointing Chinese data saw inflation print at 1.6% while Producer Prices contracted for the 43rd consecutive month, printing at -5.9%.
- Gold prices set a new high under the premise of ‘looser for longer’ as it becomes more apparent that the Fed might back off of a 2015 rate hike.
- Global equity markets are on edge as we get deeper into US earnings season, and heightened volatility could exist over the next three trading days as we wade through numerous data points.
1. Chinese inflation disappoints: Following yesterday’s massive miss in trade data that saw Chinese imports drop by 1/5th (-20.4% contraction to be exact), China posted inflation numbers below expectations, printing at 1.6% versus an expectation of 1.8%, and down from the 2% print for August. Perhaps more troubling were Producer Prices, which were down -5.9%; bringing the tally to 43 consecutive months of negative readings for PPI. This extends the raft of bad Chinese data that creates concern for how aggressively the slowdown is hitting within the Chinese economy.
The Chinese government targets 3% inflation, and given the lackluster reads throughout the year, this opens the door for more stimulus in the not-too-distant future. The People’s Bank of China has already cut interest rates five times since November along with multiple adjustments to bank reserve requirements, and weak inflation means that they have the latitude to go for more easing without stoking inflationary concerns. Accordingly, the PBOC weakened the reference rate for the Yuan last night, and Gold saw a quick pop higher before giving back those gains.
This highlights another mannerism of playing the ‘looser for longer’ theme. Should the Fed back off of a 2015 rate hike and should the Chinese government continue to roll out measures to offset weakness in their economy, Gold could be a really attractive avenue to be invested in given the decreasing inflation and rate forecasts that will likely come along with this Central Bank dovishness.
As a proxy – look at the way that Gold priced during China’s ‘Black Monday’ on August 24th. As much of the world was embarking on a flight-to-quality, investors were loading up Gold positions as it became apparent that we probably weren’t going to see an interest rate hike anytime soon. Gold peaked at just below $1,170 on this ‘safe-haven’ run. As normalcy was restored, Gold pulled back, but created a ‘higher-low’ before trending-up again. And last night, as another disappointing Chinese report came into markets – Gold broke above $1,170 in a quick move, only to pull back during the European session.
There are a few significant levels of interest in Gold shown on the chart below. $1,155 is a key level, as this is the 61.8% Fibonacci retracement of the ‘secondary move’ in Gold, and this could be a key level for staging a long position in the yellow metal. You can click on the below chart for a larger image, or if you’d like to read a more in-depth report, you can view the Gold Price Outlook that was published yesterday.
Gold as the Anti-Dollar (Daily Chart (click below for larger image))

Created with Marketscope/Trading Station II; prepared by James Stanley
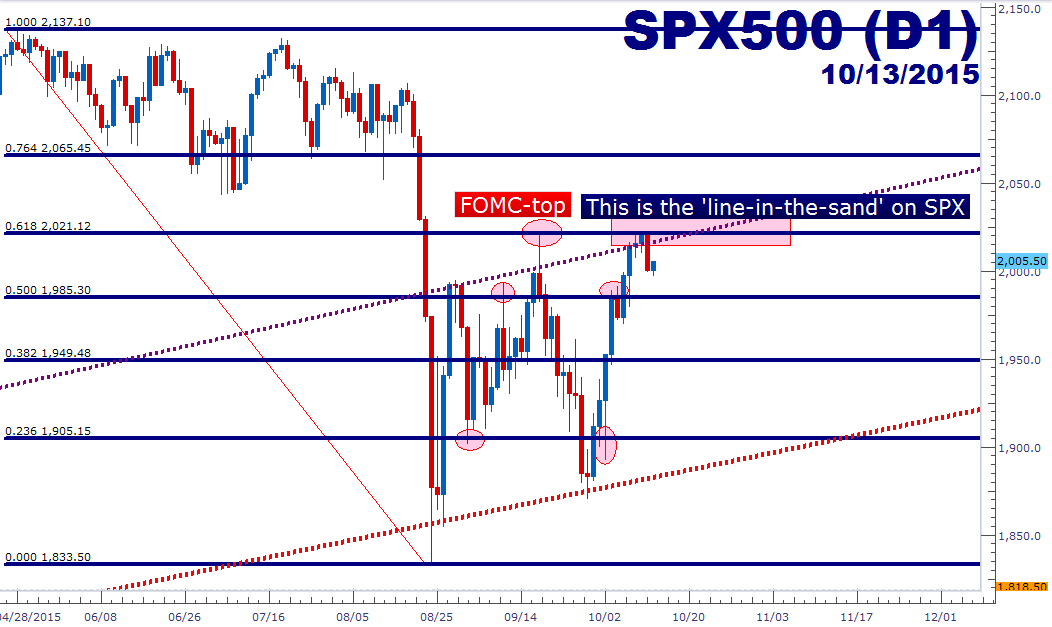
2. US Stocks reacting to resistance: In Monday’s piece, we discussed the reversal setup that was showing in the S&P 500, as prices had vaulted to a familiar level of resistance. We discussed that setup in more depth in the S&P Technical Outlook article published yesterday, and since then prices have moved down to a major psychological level of support at 2,000.
As we get deeper into earnings season in the United States, and as we get more data on key themes such as China, Commodities, and now the situation in the Syria, expect risk assets to trade with a degree of alignment; bringing back that ‘risk-on’ or ‘risk-off’ type of mentality that’s existed in markets over the past six years.
Moving forward, the Fibonacci retracement that’s offered so many setups in the S&P over the past six weeks could continue to offer strategy parameters for traders. For traders that haven’t yet sold, they can wait for a break of a lower support level to prove that the reversal may continue working. On the chart below (which can be enlarged by clicking on the image), we highlight those levels. Traders can wait for a break of the next support level, the 50% Fibonacci retracement at 1,985 before selling. If a trader wanted to treat this aggressively, they can sell on a break of 1,985. If they wanted to treat it more conservatively (which is highly advisable), traders can wait for this level to clear and let prices move back to resistance. If prices can resist at old support, traders can potentially take advantage of one of the more attractive ‘price action tells’ that the market can offer; of old support becoming new resistance in a down-trending market.
SPX Technical Outlook (Daily Chart)
Created with Marketscope/Trading Station II; prepared by James Stanley
Conversely, traders can look to buy should this 2,021 resistance level finally give way. This is the 61.8% Fibonacci retracement of the most recent major move, and this has functioned as the high in the S&P on two separate occasions over the past month. Traders can wait for prices to break above 2,021 – and then look to buy support in anticipation of trend-resumption higher. While it may seem like a sound assumption that ‘risk-off’ should permeate markets with the given trove of abysmal data and disappointing news, markets are relatively efficient in the fact that if this were a given – it would’ve already happened.
This is why risk management is so important, and this is why we produced Traits of Successful Traders. Because even when you’re confident of a move, markets are unpredictable, and trading is more about probabilities than they are about brute prediction.
3. Pound Pops on Positive Employment Data: Just yesterday we were looking at a very weak British Pound as the UK economy showed a negative inflation print, thereby exacerbating concerns that the slowdown in Asia and Europe has moved into the British Economy.
But just 24 hours later and we have the opposite effect: The sterling is ripping higher after employment numbers beat expectations, showing a 5.4% unemployment rate which is the lowest level since mid-2008. Wage growth moderated to 2.8% v/s 2.9%, and with the deflationary print yesterday this means that real UK wage growth is higher than at any point since the Financial Crisis.
Since wage growth is often considered to be a precursor to inflation, we’ve seen the British Pound reverse all of yesterday’s losses against most currencies, and prices are now in positive territory for the week. We discussed the current technical setup in GBP/USD in our Technical Outlook article on the pair yesterday, titled Resistance Reaction Opens the Door for Range Plays.
At this point, GBP/USD is trading in what has been a rigid area of resistance, as we’ve seen five previous trading days’ worth of price action hit resistance in the range between 1.5308 and 1.5345. These values are both Fib levels, with 5308 being the 23.6% retracement of the ‘big picture’ move (taking the 2007 high to the Financial Collapse Low – shown in blue on the below chart) and 5345 being the 50% retracement of the ‘secondary move,’ (taking the Financial Collapse low to the 2014 high).

Created with Marketscope/Trading Station II; prepared by James Stanley
--- Written by James Stanley, Analyst for DailyFX.com
To receive James Stanley’s analysis directly via email, please SIGN UP HERE
Contact and follow James on Twitter: @JStanleyFX


