Talking Points:
- EIA estimates oil’s oversupply to be over or equal to 500,00 barrels a day
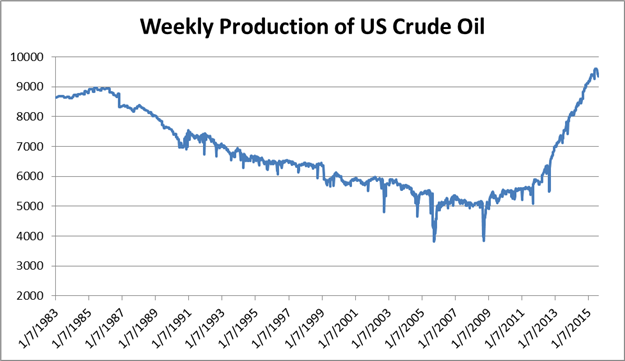
- US oil production continues to increase after passing 30 year high in October
- Oil shows consecutive losses not seen in 29 years
Oil prices hit a fresh six year low this past session on data expounding upon an already sizable oversupply. The EIA has estimated the oversupply of crude in the United States has grown between 500,000 to 3 million barrels a day. Meanwhile, OPEC’s increase of production to 31.51 million barrel a day in July surprised the market. The petroleum cartel is not the only contributor to the over production of the resource. Weekly United States production of crude shows steady increasing output in barrels per day since 2012. That puts both OPEC and the US at historical levels of production.
From price action, we can see this supply-and-demand factor translating easily. The consecutive bars indicator shows a string of 8-straight weeks of decline for US-based WTI crude, matching the worst run for the commodity in decades. This exceptional decline may be used as a signal of momentum while others may consider it an extreme and thereby a contrarian indicator.