


Talking Points:
- Demand for Gold rallied in the 4Q increasing 6%, leaving the metal down just 4% (y/y)
- Production is expected to cap in 2015 after slowing from 4.7 to 2.0 percent last year
- Gold trades in a descending wedge
With unparalleled insight, in their latest report, the World Gold Council provides a wrap-up on the metals 2014 full year supply and demand trends. Findings reveal a shift in the distribution of gold as demand for the metal strengthened in the 4Q while supply fell flat. Seasonality and external factors altered the demand composition amongst the groups—jewelry, technology, investment, and reserves—for which gold is categorically used.
While down 4% (y/y), gold grew 6% in the final quarter of 2014, reaching 987.5t. The final up-tick in demand was driven by a surge in jewelry sales amidst the wedding, festival and holiday season. Growth was greatest in India (+8%), The United States (+9%) and The United Kingdom (+18%). As the largest component of above ground gold stocks, the increase in the demand for gold jewelry has aided the metal as it continues to recover from 2009’s low, when investors partook in distress selling.
Also aiding the recovery, an elevated demand for gold as an investment and central bank reserve asset. Net investments increased 2.0% (y/y) as outflows slowed and global access improved. Furthermore, as political tensions heightened, many central banks looked to diversify away from the US dollar, instead turning to gold as a safe haven asset. With purchases near a 50 year high and up 17%, the Central Bank of Russia was the leading force adding 173t to their stocks.
Conversely, demand for gold as an input for technology fell to an 11 year low as substitution became an increasingly popular alternative.
Supply paints a different picture; while demand looks to recover production is expected to cap in 2015. According to the council, lower gold prices will make it challenging for producers to invest in new projects. The shift is already present; production slowed to 2.0% last year after growing at a rate of 4.7% between 2008-2013. The net addition to the supply chain was just 5t after accounting for the reduction in recycling.
Gold Daily Chart
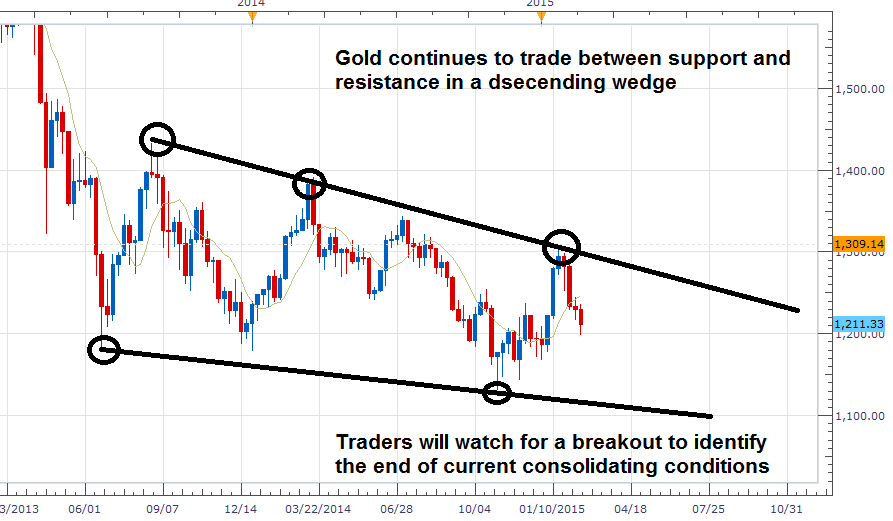
Chart Created by Walker England Using MarketScope2.0


