


Talking Points:
- EIA expects U.S. Crude Production to increase to 9.3 M barrels per day in 2015
- Week ending February 6th: U.S. rig count down 87 from last week and 315 from last year
- US Oil is Consolidating, leaving traders waiting for a breakout
Oil prices have recently been subject to volatility in response to changing data regarding the commodity’s supply, inventories, and rig counts. While long-term outlooks remain bearish, recent activity has elevated oil’s price by as much as 24.4% from the January 29th low of $43.56.
Data released by the U.S. Energy Information Administration indicates that a supply expansion is likely to continue. After increasing by 4.9 million barrels last week, U.S. commercial inventories have reached their highest level in 80 years. The stockpile is expected to continue. After assessing 7 key regions which produce 95% of the country’s oil and natural gas, the EIA expects new-well oil production to increase on average by 4 barrels per rig per day.
The added increases are forecasted to elevate total U.S. crude production from 9.2 million barrels per day, to 9.3 million/day in 2015 and 9.5 million/day in 2016. If reached, production would near the highest level obtained on record—9.6 million barrels/day back in 1970. With tight U.S. oil production and an increasing global supply, the EIA now places the average price of Brent Crude at $58/bbl in 2015 and $75/bbl in 2016.
However, in spite of supply, at present oil continues a two week climb as the average monthly implied volatility reaches its highest level since 2009. Waves were created following the release of major oil companies’ 4th quarter earnings reports as well as varying rig count data reported by Baker Hughes. The oilfield services company has placed the U.S. rig count at 1456 as of February 6th–87 down from last week and 315 down from last year.
Furthermore, a potential ceasefire between Russia and Ukraine has eased demand concerns giving the commodity some support. The deal, brokered on Thursday by Germany and France, if held, could prevent further sanctions, kick starting economic growth.
US Oil 4H Chart
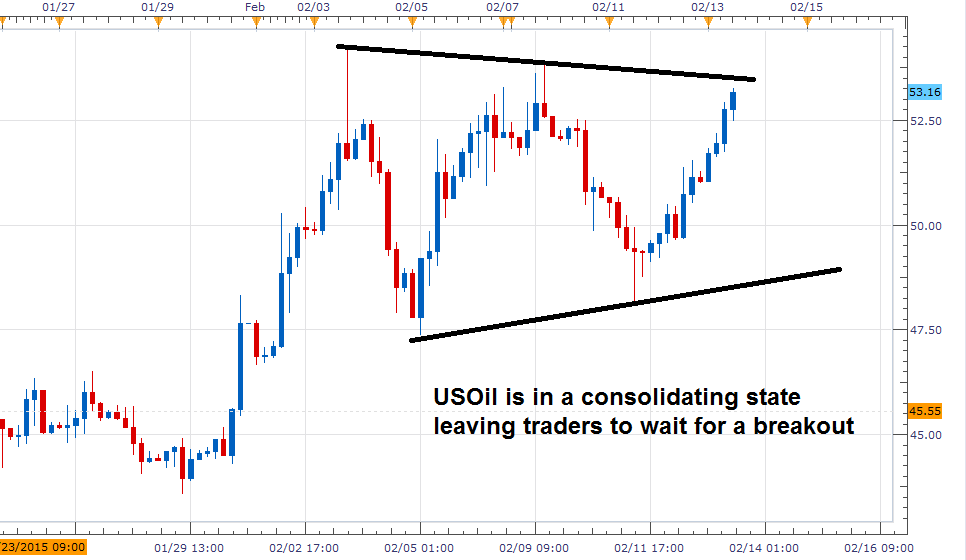
Chart Created by Walker England Using MarketScope2.0


