


Talking Points
- FOMC minutes were released yesterday, and in standard fashion, they said quite a bit without saying anything at all. But we may be headed for more confusion from the Fed.
- While the world squarely focuses on that first rate hike in nine years, commodities are continuing to bleed. The ramifications and reasons for this should not be understated.
- We discussed the themes going on in Copper and Gold on Tuesday, and today we focus on US Oil as we’ve just crossed the psychological $40/barrel level.
1. FOMC Minutes were released yesterday: and were fairly messy with somewhat of a hawkish overall tone, with the big takeaway being the addition of the phrase ‘it may well become appropriate’ to hike rates in December. This addition to the statement indicates that the Fed may be closer to that December rate hike; and when taken into consideration that this meeting and that statement happened before the blowout NFP report in November, it should make December look fairly certain for that first rate hike in nine years.
But as we said – these minutes were messy. We did see a potential divergence within the Fed, and this could end up becoming a headache for markets in the coming months. While we’ve seen a two-way tug-of-war within the bank, with the proverbial ‘hawks’ v/s ‘doves’ matchup squaring off against each other over the past nine years, we may be seeing a third group develop. Some Fed members think that the criteria for hiking rates ‘had already been met,’ while a second group thinks that criteria ‘could well be met’ in December, and a third group has said that they think it is ‘unlikely that the information available by the December meeting would warrant’ a hike.
So now we have the hawks (ready to hike), the doves (planning on December being ready to hike) and the super-doves (who want ‘looser for longer.’)
It really is no wonder that there is so much utter confusion around this first rate hike… and this is a primary reason that the Fed has become such a source of concern. We discussed this after the September FOMC meeting in the article, Are Global Markets Losing Confidence in the Fed.
Judging by market’s reaction to yesterday’s FOMC minutes, there is definitely something going on there. The ‘what’ is a little more unidentifiable right now: But after these FOMC minutes dropped, which had an overall hawkish tone given that most members are either ready to hike or expecting to be ready to hike, the US Dollar moved lower. And stocks moved higher. And treasuries didn’t move down (prices stayed flat, so yields stayed flat, and there was no increase in yield based on the expected hike in December), and this is like the market saying ‘ok, sure Fed, we believe you this time /sarcasm.’
This could have the illusion of profit taking, but the continued ascension in stock prices doesn’t really fit with that narrative. This really has the feel that markets are expecting the Fed to back off of December despite the fact that most signs (and most Fed members) are pointing to a ‘yes’ for that next rate hike vote.
For now – follow price action. Price action will show you the most accurate assessment of what markets are pricing in, near-term, and for traders this can be a huge benefit in a messy environment highlighted by messy data. This makes logical sense because the guys at Goldman Sachs or any other bank on the street are pretty smart at this stuff, and as news comes in or more evidence becomes available on this theme of a December rate hike, these players will price that in. What does that create? Supply and Demand from the biggest pieces of the market, and that, in-turn, creates price movements. This is that concept of ‘Efficient Markets,’ and regardless of which form you subscribe to, you have to acknowledge the fact that ‘the market is always right.’
The best description of the recent price action in USD would be ‘meh’ with a bullish tint. After bottoming out in October, and catching support off of this upward-sloping trend-line, the Dollar has been on a massive bull run. A hawkish FOMC statement towards the end of October and a really strong NFP report added some rocket-fuel to this trend, and the US Dollar ascended to a new 12+ year high. But, since that NFP report the Dollar has been chopping around, putting in the initial signs of a congestion pattern coming in the market.
On the below chart, we can see that massive spike that came after NFP. And we can also see how the Dollar has basically just ranged around for the two week’s since. But this isn’t necessarily a bad thing, this just means that either a) markets are unsure that the Fed will actually hike or b) that December rate hike is, essentially, already baked in. But again – the beauty of price action is that you don’t have to guess, just let the chart do the dirty work for you. Near-term, we have a range: So trade the range. How you do it depends on how you want to treat the move… if you legitimately want to get long USD for a longer-term or ‘bigger picture’ play, maybe against Euro’s to pick on the ECB or the Yen if you think the BoJ is going to extend their QE, you can simply look to buy the Dollar at or around support against these currencies. Once price action on USD moves back up towards this zone of resistance, you can use that as an opportunity to tighten up the risk on the setup by moving the stop to break-even and/or beginning to scale-out of the move. That way, if we get that top-side breakout, you’re already set. Alternatively, traders can treat this like any ol’ range. Buy support and sell resistance, wash, rinse and repeat. Just make sure those stops are at good levels in case you catch a breakout against your position.

Created with Marketscope/Trading Station II; prepared by James Stanley
2. This can create some additional pressure: The bloodbath in commodities continues, and there are little-to-no signs of stoppage. In, Follow the Leader, Apple, Oil to Cue Global Markets, we discussed how oil prices can have a type of leading quality for economies that have seen considerable appreciation on the back of strong oil prices (that were the case up until last year).
The United States certainly falls into this category, as the shale-boom has put the United States in a position to, unbelievably, begin exporting oil. What was previous one of the bigger pressure points on imports could potentially become an export with the massive amount of oil that’s been produced from fracking, horizontal drilling, and enhanced exploration driven by super-low rates, and really high oil prices.
Just think of it from this position: Go back to 2010 or 2011 as Oil prices are spiking higher after the Financial Collapse. Oil prices are running higher, $80, $90, and then $100. If there is a shale boom going on in your country, this essentially becomes a carry trade. You can go to the bank and borrow money while rates are really, really low – and then use that cash to go and lease land in order to ‘frack it,’ and then you can sell that oil, cover your debt and pay interest costs, and get a nice little profit left in your pocket. Not too indifferent than what we do in the FX market with carry positions.
This is precisely why production will increase as prices run; there is far more incentive to drill (or frack) for oil if prices are high. And as that production ramps up, prices come down to account for this new, additional supply. And then eventually, there is way more supply than needed, so prices really begin to come down quickly, and all of the sudden, no longer are those ‘carry trades’ profitable. This then crushes production, supply goes down, and then prices move up to reflect this lower supply; and this relationship continues, and continues and continues. This is somewhat of the essence of the theory behind ‘Commodity Super Cycles,’ which were soundly dismissed by many economists given the continued growth rates in China over the past five years despite the fact that commodity prices were moving lower (this was directly counter to the expansionary portion of the theory behind super cycles). But what this critique did not account for is the distortion in the global economy produced by ZIRP and QE. This ‘extraordinary accommodation’ complicates matters considerably. And given that we’ve never seen the global economy firing simultaneous stimulus programs, it only reasons that there are some ‘peculiarities’ going on.
Nonetheless, supply and demand are not debatable, regardless of your opinion on Commodity Super Cycles. And right now, we’re in the pain portion of that relationship on US Oil. Prices spiked, production ramped driven by really low rates, and now there is way more supply than demand and prices are moving lower to reflect this.
How low do they go? Nobody knows, and you never really will. Any guesses are just theories based on historical relevance. Likely, we’ll see this theme continuing to snare victims. As oil prices run lower to reflect this ramped-up supply, these producers that went out to the bank to borrow money to drill oil are likely to feel some pain. One easy way to watch this theme is in the ETF of ‘HYG,’ representing High-yield debt or junk bonds. There’s considerable energy exposure within this debt, and we’re still seeing this priced more in-line with oil prices than risk assets.
In a true risk accumulation market, High-Yield should be attractive; because if rates are going up to illustrate a strong economy, junk bonds *should* have a higher probability of pay-off. This creates demand and higher prices and lower yields… but that is the opposite of what we’re seeing right now.

Created with Tradingview; prepared by James Stanley
3. Where do we go from here? These are all pretty ‘big picture’ ideas, and can be difficult to translate into direct trade setups; but as a trader, that’s all that really matters. The narrative is just noise. The setups are what matters.
George Soros alluded to the fact that markets are least efficient near tops or bottoms of moves; and that’s because of reflexivity. As in, the pandemonium around an issue can actually become bigger than the issue itself. This is why bubbles build, and also why they pop. It’s also why trends will often run too high only to correct back, and why down-trends often over-shoot to low only to pull back and congest.
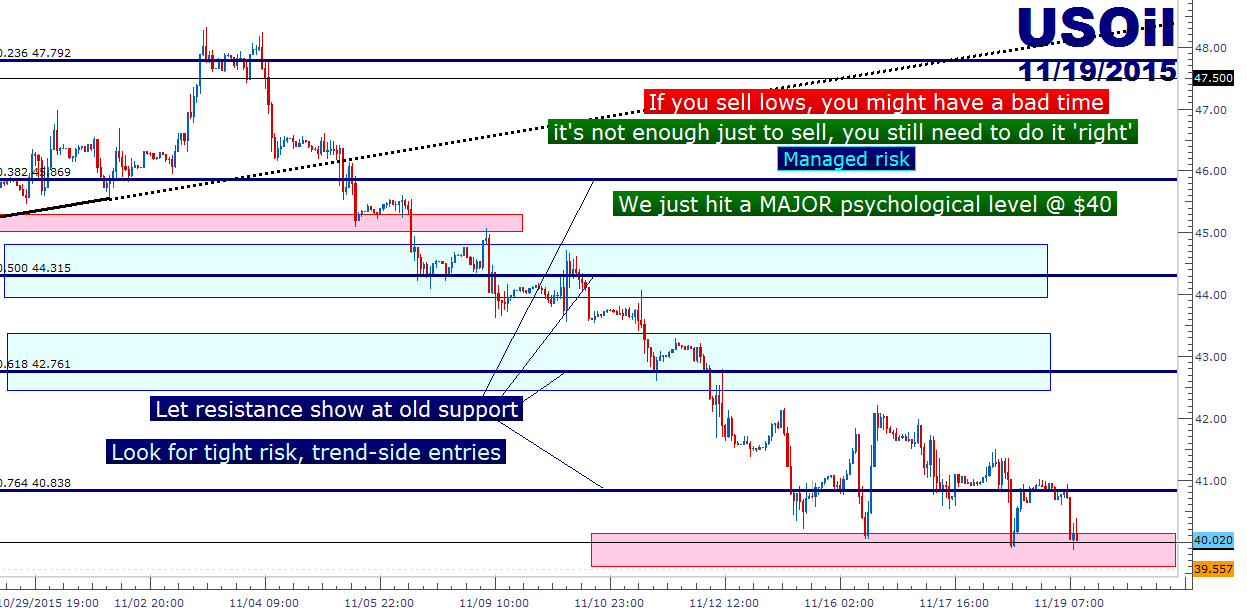
On Oil, I’m of the opinion that we’re nearing the ‘inefficient’ portion of the move if we aren’t there already. It isn’t enough to just throw a sell order out there and hope that this theme continues. As a trader, you still have to treat the move correctly. This is what we teach in the 360° course, find the theme, line up the trade, and set a risk management plan-of-attack.
The below chart on US Oil illustrates the current setup. We’ve just crossed the psychological $40/barrel level, again, and are seeing support come in, again. After a big move and with such a strong potential support level, it can be really tough to push the trend right now. While the down-trend looks really attractive, it’s not enough to ‘just sell and hope.’ You have to balance your options of a) missing the move or b) selling a bottom. Which would you rather have happen? That should denominate your stance.
If you’re in camp a, which most traders should be, let price run up to resistance and look to sell with a relatively tight stop. Look to avoid that Number One Mistake that Forex Traders Make, even in a bleeding market. There is no trade that’s too great to pass up, because any one trade can cost you a significant amount of capital. And as a trader, your capital is all that really matters, and any one trade is but one of a thousand insignificant trades that will define your career.
Created with Marketscope/Trading Station II; prepared by James Stanley
--- Written by James Stanley, Analyst for DailyFX.com
To receive James Stanley’s analysis directly via email, please SIGN UP HERE
Contact and follow James on Twitter: @JStanleyFX


