


To receive Michael’s analysis directly via email, please SIGN UP HERE
- Bitcoin breakdown approaching near-term support targets- risk remains lower
- Check out our quarterly projections in our Free DailyFX Trading Forecasts
- Join Michael for Live Weekly Strategy Webinars on Mondays at 12:30GMT
It’s been a rough week for cryptocurrencies with downbeat headlines alongside a rebound in the U.S. Dollar fueling a perfect storm for the recent collapse. You may have noticed my focus has been more on Ethereum as of late, but recent price action in Bitcoin has finally offered some clarity. Here’s what the charts are saying.
BTC/USD Daily Chart (Log-Scale)
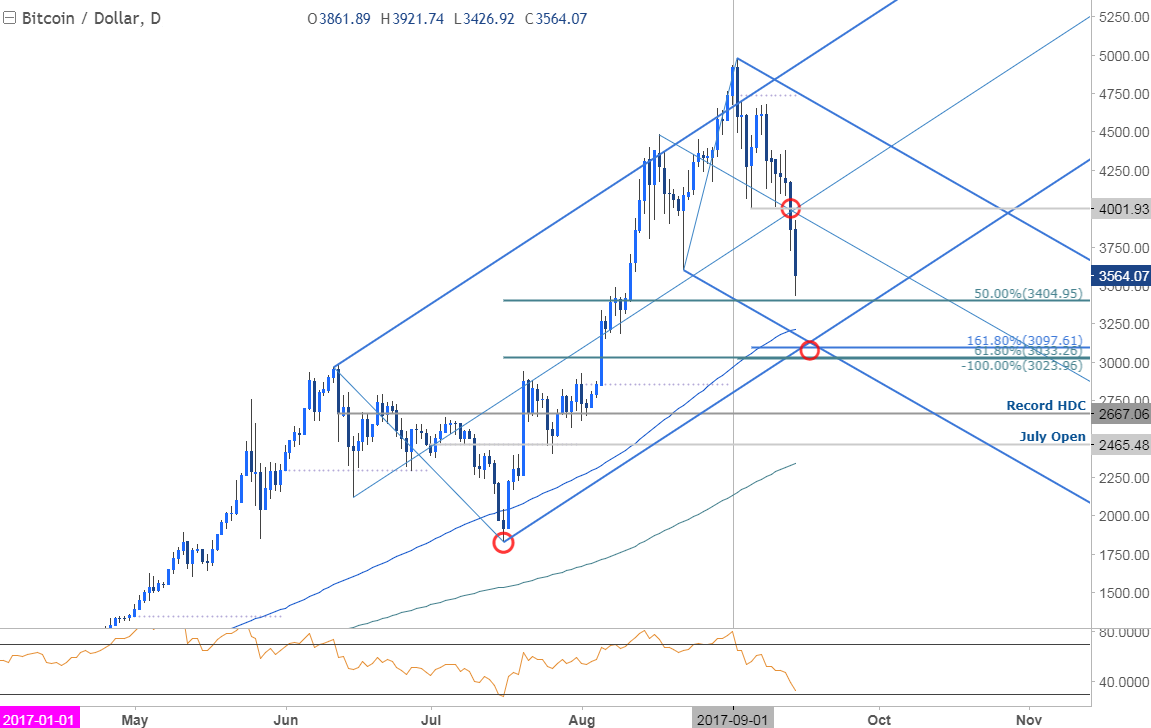
Technical Outlook: Bitcoin prices failed to hold above the upper median-line parallel (and was followed by and outside-day reversal off the highs) with a subsequent break below the monthly opening-range yesterday keeping the focus lower in the crypto currency. Interim daily support rests with the 50% retracement at 3404 with a more significant support confluence eyed at 3023/97- this region is defined by a host of Fibonacci considerations and converges on the lower parallels heading into next week. Resistance now stands with the median-line with a close back above 4002 needed to invalidate the current bearish outlook.
New to Forex? Get started with this Free Beginners Guide
BTC/USD 240min Chart
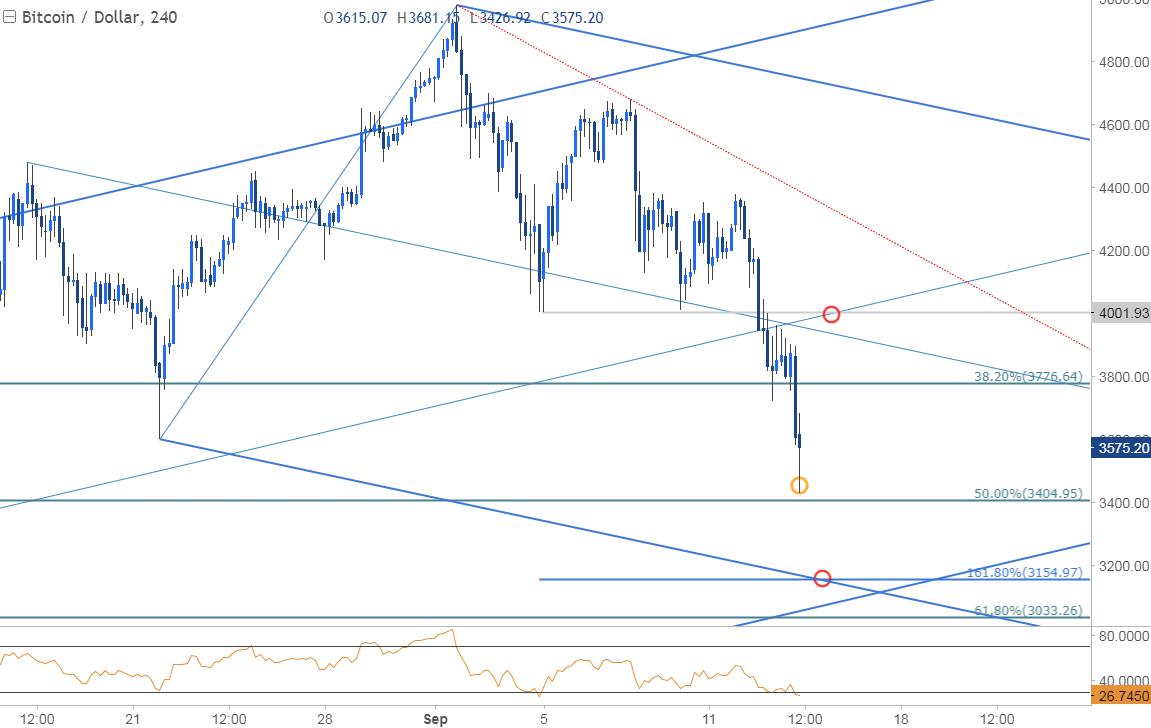
Notes: A closer look at price action highlights Bitcoin trading within the confines of a near-term descending median-line formation with prices slipping below support at 3776 today in early European trade. From a trading standpoint, the focus remains lower while below 4000 with a breach above the September trendline resistance (red) needed to shift the focus towards the upper parallel (currently ~4370s).
That said, a break lower from here targets the lower parallel / 161.8% extension at 3155 backed by the key 61.8% retracement of the July advance at 3033 and the head and shoulders measured objective at 3023- both levels of interest for near-term exhaustion / long-entries. Bottom line: look to sell rallies for now with the decline to ultimately offer more favorable long-entries near the key structural support confluence noted earlier.
Join Michael on Friday for his bi-weekly Live Webinar on the Foundations of Technical Analysis- Register for Free Here!

- A summary of IG Client Sentiment shows traders are net-long BTCUSD- the ratio stands at +1.65 (62.2% of traders are long) – bearish reading
- The percentage of traders net-long is now its lowest since Sep 1st when it traded near 4864.43
- Long positions are 5.7% lower than yesterday and 12.9% lower from last week
- Short positions are 16.8% higher than yesterday and 37.2% higher
- We typically take a contrarian view to crowd sentiment, and the fact traders are net-long suggests Bitcoin (USD) prices may continue to fall. Yet traders are less net-long than yesterday and compared with last week. Recent changes in sentiment warn that the current Bitcoin price trend may soon reverse higher despite the fact traders remain net-long.
See how shifts in retail positioning are impacting trend- Click here to learn more about sentiment!
---
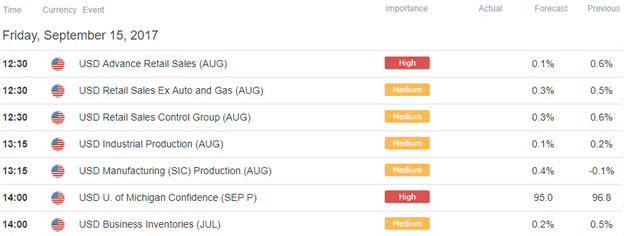
Relevant Data Releases
Check out this week’s DailyFX Webinar Schedule
Other Setups in Play
- Ethereum Prices Search for Support as Adoption Doubts Intensify
- EUR/USD Battle Lines Drawn
- A Weekly Technical Perspective for USD Majors
- Technical Setups for the Week Ahead as DXY Flirts with Disaster
- GBP/USD Struggles at Resistance- Weakness to Offer Opportunity
- Written by Michael Boutros, Currency Strategist with DailyFX
Follow Michael on Twitter @MBForex or contact him at mboutros@dailyfx.com.


