GOLD & CRUDE OIL TALKING POINTS:
- Gold prices struggling for follow-through, chart warns of topping
- Crude oil prices remain pinned to support near $55/barrel figure
- Markets eyeing US-China trade talks, Fed policy call for direction
Bellwether commodity prices are idling as markets brace for a week loaded with heavy duty event risk, from the resumption of US-China trade negotiations to a much-anticipated Fed monetary policy announcement. The former will bring USTR Robert Lighthizer to Shanghai for the first face-to-face with Beijing officials since talks broke down in May. The latter is widely expected to bring a rate cut.
It seems too early to hope that Washington and Beijing with secure a decisive breakthrough, but a bit of reassurance in the surrounding commentary from key officials may cheer investors somewhat. The Fed might quickly quash any such optimism. It has been reluctant to pre-commit and so probably will not endorse the markets’ call for 25-50bps in further easing before year-end, souring sentiment.
Traders will probably withhold directional conviction at least until the US central bank has had its say, with lackluster progress one way or another in the interim. Pace-setting S&P 500 futures are pointing to a cautiously risk-off start to the week. That might translate into slightly weaker crude oil prices. Meanwhile, gold may have to balance a supportive downtick in bond yields with a slightly stronger US Dollar.
Get the latest crude oil and gold forecasts to see what will drive prices in the third quarter!
GOLD TECHNICAL ANALYSIS
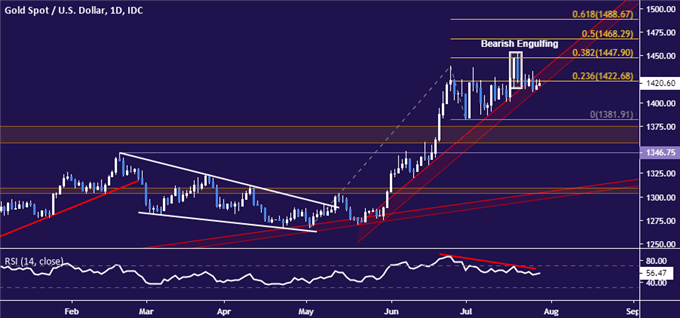
Gold prices are stalling but a Bearish Engulfing candlestick pattern coupled with negative RSI divergence continue to hint a top is taking shape. A daily close below rising trend support opens the door for a test of the July 1 low at 1381.91. Alternatively, a breach of the 38.2% Fibonacci expansion at 1447.90 targets the 50% level at 1468.29.

CRUDE OIL TECHNICAL ANALYSIS
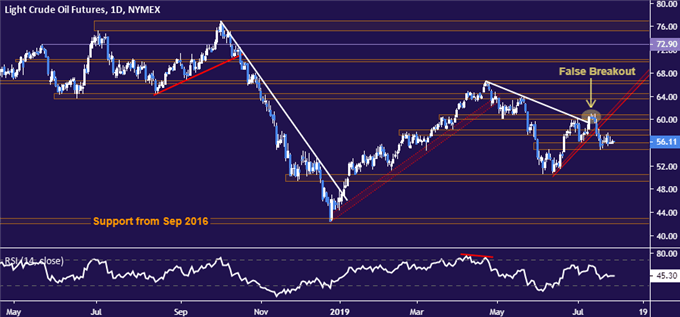
Crude oil prices remain locked in a narrow range above support at 54.84. A break downward confirmed on a daily closing basis initially exposes the 49.41-50.60 area. Alternatively, a rebound above resistance at 58.19 sets the stage for a retest of the 60.04-84 zone.

COMMODITY TRADING RESOURCES
- See our guide to learn about the long-term forces driving crude oil prices
- Having trouble with your strategy? Here’s the #1 mistake that traders make
- Join a free webinar and have your commodity market questions answered
--- Written by Ilya Spivak, Currency Strategist for DailyFX.com
To contact Ilya, use the comments section below or @IlyaSpivak on Twitter


