


CRUDE OIL & GOLD TALKING POINTS:
- Crude oil prices idle in familiar range, API inventory data due
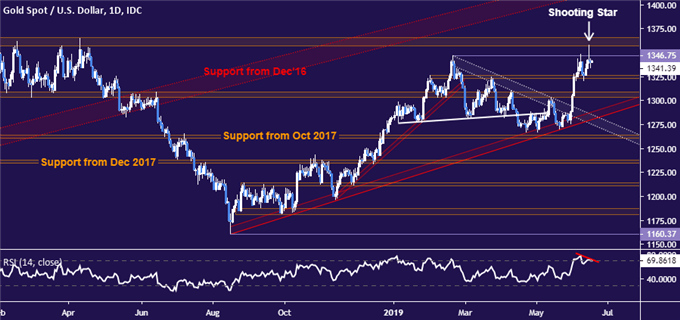
- Gold prices continue to show signs of an emerging double top
- Commodities waiting for FOMC before committing to direction
Commodity prices idled at the start of the trading week, as expected. The standstill probably reflects investors’ unwillingness to commit ahead of potent event risk in the coming days. Needless to say, the FOMC monetary policy announcement stands out on that front.
The US central bank will update its official rate path outlook, which markets expect will bring a substantial dovish revision. If that proves accurate, swelling risk appetite might lift crude oil prices while the US Dollar weakens alongside bond yields, lifting gold.
Investors already price in 2-3 rate cuts this year along with the end of the Fed’s quantitative tightening (QT) balance sheet reduction effort, however. That would mark an improbably dramatic about-face for policymakers. That means a relatively hawkish surprise seems like a greater risk than the alternative.
Looking ahead, a barebones offering on the economic calendar and inconclusive cues from bellwether S&P 500 futures – a baseline for prevailing sentiment trends – hint at another inconclusive session. API inventory flow data is on tap and will be weighed against bets on 1.77-million-barrel drawdown.
Did we get it right with our crude oil and gold forecasts? Get them here to find out!
GOLD TECHNICAL ANALYSIS
The appearance of a Shooting Star candlestick coupled with negative RSI divergence hints at a double top taking shape on a test of resistance marked by February’s swing highat 1346.75.Breaking below initial support in the 1323.40-26.30 area exposes the 1303.70-09.12 zone. Alternatively, a move back above 1346.75 opens the door to test the 1357.50-66.06 regionnext.
CRUDE OIL TECHNICAL ANALYSIS
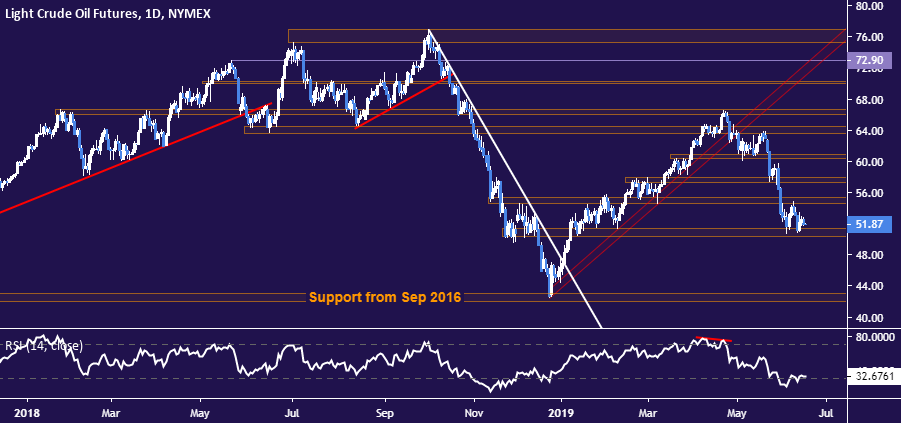
Crude oil prices continue to tread water at support in the 50.31-51.33 area. A daily close below it sets the stage to challenge a floor set from September 2016 in the 42.05-43.00 zone. Alternatively, a turn back above the upper layer of near-term resistance at 55.75 targets the 57.24-88 region next.
COMMODITY TRADING RESOURCES
- See our guide to learn about the long-term forces driving crude oil prices
- Having trouble with your strategy? Here’s the #1 mistake that traders make
- Join a free webinar and have your commodity market questions answered
--- Written by Ilya Spivak, Currency Strategist for DailyFX.com
To contact Ilya, use the comments section below or @IlyaSpivak on Twitter


