


Talking Points:
- Oil traded flat after mixed API stock report, Cushing build implies glut may resurface
- Gold at 5-year low after positive US inflation data, prior to FOMC’s minutes
- Copper at 6-year low as fundamentals point to rising supply vs. falling profits
Gold tumbled to the lowest since March 2010 at 1065.6 as US dollar strengthened and market awaits minutes of the last FOMC’s meeting tomorrow (Sydney). Overnight, U.S. inflation figure rose 0.2 percent for a second month, the strongest consecutive gains since April-May, led by increases in rents and health-care costs. Higher inflation boosts confidence of a rate hike and the resilience of US economy.
Copper price slump has proven problematic not only for investors but also producers. Copper plunged to the lowest in six years on both the London Metal Exchange and NYMEX on Tuesday, amid fears of slowdown in China demand and carry trades, while USD strengthened.
The rout in commodity prices has intensified pressure on mining stocks in STOXX Europe, including Glencore. However structural cutbacks, e.g. capital expenditure and operating mines, may take a while to filter through to impact supply.
In the meantime, an aggregated index of average copper premiums ($/metric ton) including the US Midwest, Europe, Shanghai LME and Singapore LME, is close to its 5-year low since the second-quarter of 2015. This corresponds to a supply surplus since the fourth-quarter of 2014 as detailed World Bureau of Metals Statistics.
Oil picked up marginally after a 3.45 percent loss overnight. Weekly stock data from the American Petroleum Institute showed crude stocks dropped by 0.5 million barrels to 485.7 million, however stocks at Cushing hub rose by 1.3 million barrels. If the gain at Cushing is confirmed by U.S. Department of Energy today, it would effectively place a cap over topside of oil price.
GOLD TECHNICAL ANALYSIS – Weekly gold chart shows it is testing 1065.5 support level for a second time, with momentum signals leaning to further decline. A support below that comes at 1044.7, then the 1000 big figure.

Weekly Chart - Created Using FXCM Marketscope
COPPER TECHNICAL ANALYSIS – For 3 weeks straight, copper has shred around 4.5% or more every week. As our data does not go beyond 6 years, it is hard to gauge a support level from here. One thing is clear, weekly momentum still points to further downside for copper price. The bears could refer to a previous support level at 2.2025 as a resistance level for now.
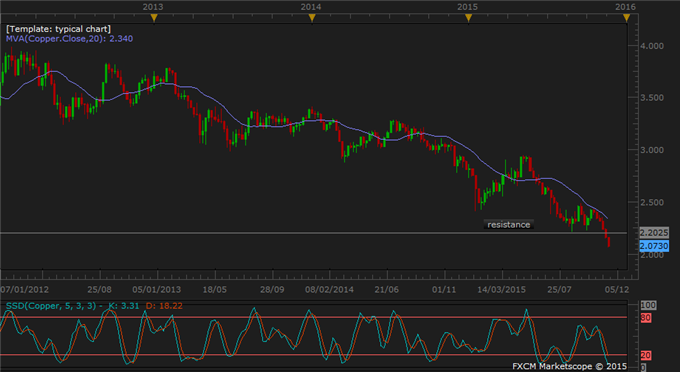
Weekly Chart - Created Using FXCM Marketscope
CRUDE OIL TECHNICAL ANALYSIS – WTI oil is on a 4th day of consolidation above the 40.07 support level, which may prolong under the influence of upward momentum. However, topside is also limited and there is no concrete opportunity for the oil bulls. The bears should be cautious of any rebound from here.
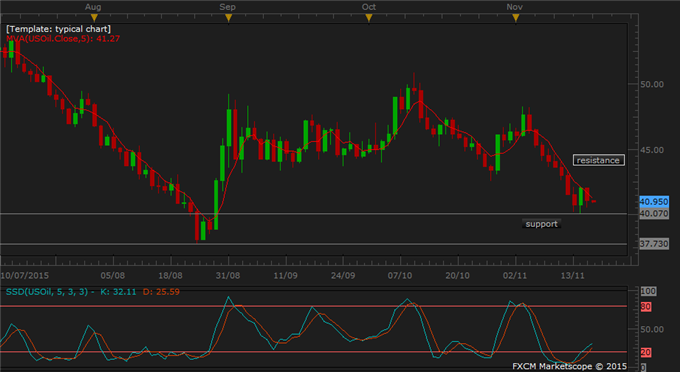
Daily Chart - Created Using FXCM Marketscope
--- Written by Nathalie Huynh, Currency Strategist for DailyFX.com
Contact and follow Nathalie on Twitter: @nathuynh


