


Talking Points:
- Volatility returns to oil on last trading day, downside risk from supply data by API
- Safe haven bid for gold subsides as political tension eases and Fed is back in focus
- Copper plunges to new 6-year low before industrial data in US, Eurozone
Gold price gave back some of its safe haven leverage as anxiety on European political risk subsided. Broad gains in USD overnight also sent commodities lower. Bullion spent most of Asia’s session in the 1080s and lingered below a previous support-turn-resistance at 1085.5. Downward pressure will likely return to dominance once market’s focus shifts back to an imminent Fed rate rise.
In spite of a rebound in Asian stocks, copper price (and industrial metals) fell to the lowest since May 2009 as demand concerns loom large. This prompted Codelco, world’s largest producer, to cut the premium charged to Chinese buyers by the most since the financial crisis. More hints from the US and Eurozone will emerge via U.S. Industrial production data and Eurozone’s construction output tomorrow.
Oil price experienced heightened volatility on the last trading day of the November futures contract as investors covered their shorts or roll over positions. WTI price fell to 40.07 then picked up above 42 before it stabilized in range 41.60-80 in Asia’s trade. Volatility may return after a weekly inventory data by the American Petroleum Institute today, which is expected to signal another stock build thus supply-demand imbalance prior to official data by EIA.
GOLD TECHNICAL ANALYSIS – After a day of rebound, gold marked a 5th day of declines within 6 straight days. Firm support at 1074.25 is holding through this volatility. A breach of support would be a clear sign of downtrend resumption. Otherwise gold may continue its consolidation in the 1080 region.
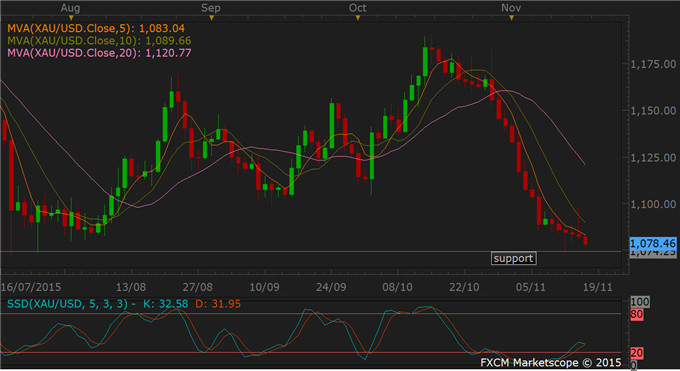
Daily Chart - Created Using FXCM Marketscope
COPPER TECHNICAL ANALYSIS – The weekly chart shows copper on a 6th week of decline with ever stronger downtrend signal. There is no stopping to this free fall in prices. The bears could look to 5-day moving average for an indication of topside resistance and to place their stops.

Weekly Chart - Created Using FXCM Marketscope
CRUDE OIL TECHNICAL ANALYSIS – WTI oil tested and failed to break below the 40.07 support level for the second time yesterday. Upward momentum signals led to a rebound up to 42 levels. Topside remains limited in the absence of trend signal, calling for caution by the bulls. Although there are not yet signs for a breach of the floor either.

Daily Chart - Created Using FXCM Marketscope
--- Written by Nathalie Huynh, Currency Strategist for DailyFX.com
Contact and follow Nathalie on Twitter: @nathuynh


