


Talking Points:
- Oil rebounded on early bullish bets though supply excess dragged on
- Gold spiral up as risk-off sentiment followed unchanged interest rate
- Copper weighed by China concerns and undisruptive supply
The market appeared to takethe Federal Reserve’s warning on global growth outlook to heart with a broad risk sell-off late Friday. US shares, risk currencies, and commodities sank, effectively squared the gain acquired after Fed kept rate unchanged.
Asia continued this risk-off theme as the week started, while Japan is on holiday until September 23. The ASX, Hang Seng were deep in red while Aussie government bonds ascended. Gains in the resilient Shanghai Composite were the only risk-positive signal and commodities took cue to tick up lightly.
Oil rebounded around 1 percent after Asian noon time as US companies cut oil rigs for a third week and bullish speculations arose. Hedge funds cut their bearish bets while money managers piled up the most WTI long positions since July 7, data from the US Commodity Futures Trading Commission (CFTC) showed.
Oil dipped below the 20-day moving average to 44.24 late Friday in New York yet quickly bounced back to the high 44s. Market seemed unimpressed with OPEC’s report on potential price of $80 a barrel in 2020.
An oversupply deepened as Wall Street Journal cited US official sources that Iran nuclear deal is set to commence on October 18, although the actual implementation date will be much later. Iran’s oil minister has consistently promised an extra 1 million barrels a day once production is in full swing.
The latest threat to oil price came from the world’s biggest crude exporter Saudi Arabia, its commercial petroleum stockpiles rose to the highest since 2002 at 320 million barrels. This report on Sunday indicated Saudi has not relented its stance in the oil price war.
Gold was an apparent beneficiary of market volatility after the Fed’s meeting. It shot up instantly as the Committee kept interest rate near zero for longer, and mounted another step to peak at 1141.84 when risk assets were sold and haven assets bought in the ensuing development.
The precious metal currently enjoys a boost from Asia’s risk-off stance, and will linger near its top as long as sentiment persists. Gold’s topside is loosely capped by a widely accepted speculation that the Federal Reserve will still raise interest rate before the year-end. Resistance levels to watch are 1148 then 1170.16.
Coppersank to a new two-week low at 2.3625 early in the Asian morning on broad China growth concerns andhas barely recovered since. This followed declines in most metals, with Zinc at the lowest since June 2010. Assuring news from Chile that copper mines were largely not affected by recent earthquakes momentarily overshadowed Glencore’s supply cuts and dragged copper price down.
A small reprieve to copper came from a Shanghai stock rebound. The index rose to a three-day high just before the exchange’s lunch break. Copper will likely stay above the recent bottom, with a support-turn-resistance at 2.3885 above.
GOLD TECHNICAL ANALYSIS – As outlined in previous technical analysis, a break of 38.2% Fibo opened up the area above that and towards 1151.79 (50% Fibo) for gold. This range will likely contain prices for a while since upward momentum nearly peaked out at its upper bound. Downside, support level trails the 20-day moving average at 1124.22. Gold bulls may keep a close watch of their stops.
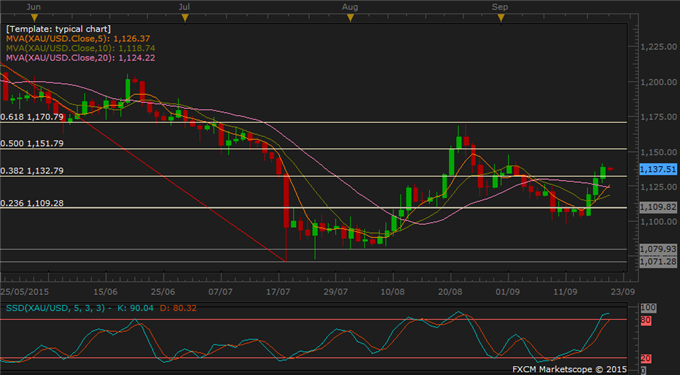
Daily Chart - Created Using FXCM Marketscope
COPPER TECHNICAL ANALYSIS – Copper failed to break through a critical Fibo levels at 2.4899 both on the daily and weekly charts last week. This was a considerable signal that a top has been established and further downside price action could follow. Today the metal barely hung on to a lower Fibo at 2.3822 with downside bias, although the magnitude of declines may clamp down after Friday’s large move. A firm support comes at 2.3060 where the bulls may consider long bets.

Weekly Chart - Created Using FXCM Marketscope
CRUDE OIL TECHNICAL ANALYSIS – WTI oil touched down on 20-day moving average at 44.72 today as momentum indicated downward pressure is building. The MA has supported oil’s downside during September correction and it is unclear whether it would eventually give way this week. Range traders may find opportunities to enter positions at the lower bound of range, within proximity of this MA and 23.6% Fibo at 43.40. No directional signal has emerged yet.

Daily Chart - Created Using FXCM Marketscope
--- Written by Nathalie Huynh, Currency Strategist for DailyFX.com
Contact and follow Nathalie on Twitter: @nathuynh


