


Talking Points:
- Join us today, January 29, 2016 at 14:00 GMT for a special webinar on this topic.
- Market efficiency thrown into question as traders punish energy markets.
- Oil collapse has hit the Middle East hard, and maybe the Canadian Dollar even harder.
The Psychology of a Market Collapse
Spend enough time around markets and it’s unavoidable. When a market collapses the one question that everybody wants to ask is the one question that can’t be answered, and that’s ‘how low can it go?’
Nobody truly knows; everyone has their best guess, though – about why a market is collapsing, or how long and far the collapse will extend. The psychology of market crashes dictates otherwise; collapses get stuck in negative feedback loops, taking on lives of their own. The efficient market hypothesis states that market prices always incorporate all known information; but as George Soros teaches in The Alchemy of Finance, markets aren’t always efficient. As a matter of fact, when we have a volatile, emotional trading environment like we have in energy markets right now – in both Brent Crude (UKOIL) and Crude oil (USOIL) – efficiency is likely nowhere nearby. A full-blown crash is afoot.
Mr. Soros posited the theory of ‘reflexivity,’ in which price action becomes a type of self-fulfilling prophecy unto itself. Or, layman’s terms: falling prices scare people which provokes more selling; rising prices excite and lure new buyers in. Falling prices create emotional reactions out of investors, producers and many others with interest around those assets, and this can create outlandish types of movements really quickly. We may be here with energy markets right now.
Saudi Arabia Bears Blame for the Oil Supply Glut…
Supply and demand might not have the same type of eloquent transmission on a melting market that it might have in a normal environment (this is from the introduction of new variables, like the fear of a collapse bringing in even more selling). However, we can’t dismiss the supply glut and its impact on oil prices in recent months. Amidst falling prices, OPEC (or The Cartel Formerly Known as OPEC, as we like to call it) has relegated its pricing power as an oligarchical force in the market in favor of pumping more oil. And pumped more oil OPEC has:
Chart 1: OPEC Total Oil Production versus Crude Oil (Monthly): January 2006 to December 2015
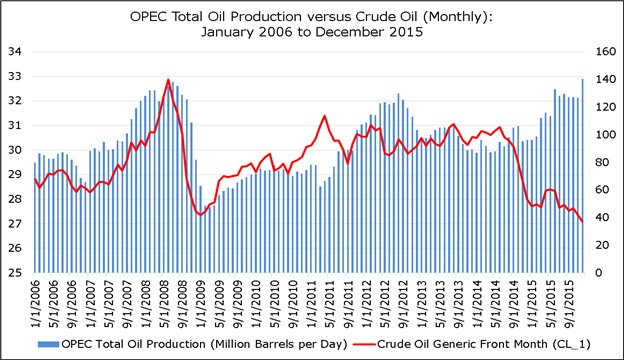
Around June 2014, it was made clear by Saudi Arabia – which accounts for approximately 30% of OPEC’s total daily output – that it had no intention of cutting supply. In fact, in successive meetings throughout 2014, market participants began to get the hint that production might not be cut, but even increase. For the futures market, for example, this was a major issue: speculators were more net-long in the week ending June 24, 2014 than they ever had been, to the tune of 458,969 contracts. From June 2014 – the last time we saw Crude oil post a monthly close above $100/bbl – to now, net-long positions in the futures market have declined by -64.4% to 163,504 as of the week of January 12, 2016. This year alone, net-longs have declined by -16.7%. It may be reasonable to think that the continued liquidation of these net-long positions will drive oil prices lower.
But from a strategic standpoint – what is trading about? Is it about guessing and hoping that something continues: definitively, “No.” Trading is about probabilities, and therefore, risk management. The Number One Mistake that Forex Traders Make is abysmal risk-reward ratios; to the point where these traders can be right 66% of the time (about two out of every three trades) and still lose money. So even if you could miraculously and continuously ‘out guess’ the market, it doesn’t mean that you’re going to make money; which, when trading, is the whole point. Risk management is paramount to any trader’s long-term success; it’s more important to make money than to be right, as they say.
…but So Too Does the Federal Reserve
Let’s bring this back home: oil prices started driving lower on supply. With rates so low during the ZIRP and the QE-reign out of the United States, a significant amount of investment was spent figuring how to drill oil out previously barren ground in the United States with horizontal drilling (and fracking). These are new methods that were previously unavailable, and with oil prices staying steadily above $100/bbl, it made sense to keep investing there. After all, it’s not like yields were all that attractive at the time. ZIRP encourages investors to take on risk and Research and Development is a prime investment when rates are cheap (think ‘internal rate of return’ versus market-based returns).
This changed the oil market forever. The United States, once the world’s largest importer of oil has now become a net exporter. The United States no longer depends on the rest of the world for oil, and this is primarily drive by the investments that flowed into drilling technology as a result of ZIRP. Now that Congress has lifted a four-decade old ban on oil exports, supply issues will persist – they are structural in nature, not “transitory” as so many central bankers have suggested. Indeed, the first US tanker carrying oil to Europe docked in Marseille, France on January 20, 2016, and it was widely expected that the second would reach port in Rotterdam, Netherlands the day after.
Clearly, a new influx of a commodity into a market has collateral repercussions. This new supply coming online means that the supply and demand picture for that market is markedly altered. For prices to stay stable, we need either a reduction in supply from other market participants, or a marked increase in demand. While the United States was a net importer of oil, this drop in prices was actually a good thing as it put more money in consumer’s pockets and they would then go and spend that saved cash elsewhere; and this is somewhat of the premise that the Fed was operating under when taking on a hawkish tone towards interest rates throughout 2015 despite the fact that oil prices were falling through the floor.
The rate hike out of the Federal Reserve in December is what really began to roil energy markets, and this isn’t just because the market is getting less efficient; but because there is legitimate and actual fallout already taking place. Those producers that went out to borrow money while rates were low in order to drill oil out of the ground under the assumption that prices would stay strong are now in a world of pain with oil at or around $30/bbl. In most cases, these outfits aren’t even profitable any longer. So every barrel of oil they drill out of the ground comes with losses attached to it. For a while, this may have been an economic necessity just to pay off the debt used to finance their projects.
We’re at that point where, with oil having serially underperformed expectations, it’s time to close up shop. The squeeze is on and there’s nothing they – small or large producer alike – can do about it. This is what precipitated the junk bond flare up in December. This type of price environment for producers leads to panic. When they shutdown operations, the banks that financed those projects will be the next on the chopping block. Those in any industry tied the oil boom – from financing, to drilling, to refining, to storage, to sales and delivery – are suffering. The collateral damage may already be appearing in economic data as the broader US economy slows: US jobless claims just hit their highest level in nine months. This is precisely the reason that market efficiency is something that only exists in academia when a collapse is on. Mr. Soros was right: Markets aren’t always efficient; if they were, they’d never blow up, just like we've been witnessing in energy markets.
Middle Eastern Budget Crises May Make the News in 2016
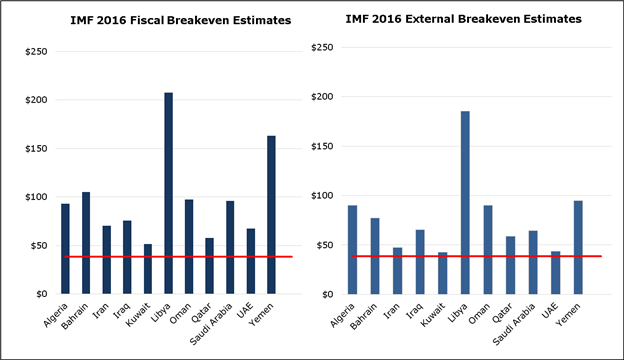
Low oil prices are sending shockwaves across major oil producers, particularly countries in the group they refer to as OPEC, a purported cartel (although, there’s something to be said about a group of oligarchical price setters who refuse to act in their own best interests). Oil prices today are below both the fiscal breakeven (the price of oil required to balance the budget) and the external breakeven (the price of oil required to balance the current account) of many Middle Eastern OPEC countries. This means pressure on governments in the region, rekindling memories of the Arab Spring; sustained low prices could result in social unrest, which would come at a particularly vulnerable time given the rise and sustained grip on power ISIS has in Eastern Syria and Western Iraq.
Chart 2: Oil Breakevens for OPEC Countries: 2016 IMF Estimates
Many accusations pointed fingers at OPEC with blames of keeping supplies high in an effort to drive American shale producers out of business. This is all merely insinuation, as there’s no evidence of such a premise – but to keep production ramped up while prices are dropping like a rock prove that there is some reason for the cartel to willingly crash prices. Maybe it’s more of a regional supply competition issue. Saudi Arabia has recognized that Iran will be an economic heavyweight in the region once more now that the sanctions have been lifted. To prevent them from being able to sell oil at a high price and reinvigorate the Iranian economy very quickly, Saudi Arabia has been coyly keeping production high to prevent a resurgent Iran, whose newly-found oil money would otherwise fund anti-Saudi efforts across the Middle East. But, as we started off with, do we truly know? Absolutely not; but the sheer range of speculation highlights how incredibly politicized the oil oversupply issue has become, and how so many varied interests are at bay here.
Chart 3: Crude Oil Term Structure: 1/22/15 versus 1/21/16
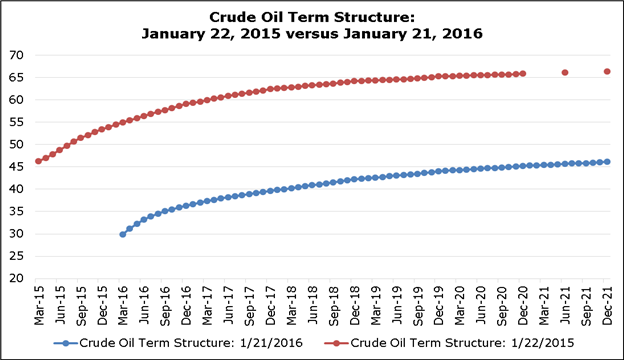
From a behavioral perspective, one has to consider the toll that the decline in oil prices have had on market expectations. Far from being “transitory,” investors have thus far made significant adjustments to their price outlooks. For example, the March 2016 oil contract traded some -45.6% on January 21, 2016 than it did on January 22, 2015. Yet as the term structures above show, oil remains in contango, or, future prices are trading higher than the current expected spot price. This is normal: there are usually storage and financing costs for holding the commodity over a longer period of time. In and of itself, however, this reflects hubris on the part of market participants. Speculators are still holding 163,504 net-long contracts in the futures market, in hopes of higher prices in the future. There is is again – hope. A terrible trading philosophy.
In the near-term, don’t try to call the bottom. It’s a fool’s errand, especially when geopolitics get involved. Instead, trade this like a professional. The trend is down and there are some very obvious pressures and reasons for it to continue. Traders can implement price action to look for ways to sell on the way down. Risk must be managed appropriately here, and if you’re looking for some help in that department, check out our Traits of Successful Traders research. The chart below shows how this can be done with current prices:
The Big Picture in Oil
When something as dramatic as what we’ve seen in oil takes place, much of the world begins looking all in the same direction. This means the market gets heavily net short, to the point where there is an increasing litmus on the news needed to continue driving prices lower. After all – if anyone that wants to sell has sold, how can price action move any lower? It can’t – unless new sellers can be enticed to jump into the market with new, fresh short positions; but even then, there is a marginal impact because how many new sellers can we expect to jump into a market?
And perhaps more importantly, when much of the market is net short – the slightest scare of higher prices can elicit a short-squeeze that can rip bears’ faces off. As prices move higher, stops on short positions get hit (which means even more buying, even higher prices, even more stops hit, etc, etc, etc.)
And looking at the big picture, how far can we reasonably expect oil prices to go? Let’s just pick and outlandish number (and a price that is extremely unlikely) of $10/bbl. With current prices in the $30-vicinity, that would mean total upside of $20 bucks. And ya, sure, that sounds great. But how much risk will you need to take on to get that move?
While oil was melting down, it didn’t have the courtesy to create any retracements that we can use for stop placement anywhere near current price action. The most recent swing high on the Weekly chart of oil is showing at a price of $50.90. Assuming oil prices at $30-even, that would mean $20.90 of risk for the potential of $20 of upside; so not even a 1-to-1 risk-to-reward ratio. This is really unattractive; especially for a bleeding market in the midst of a down-side breakout with the potential for a vicious retracement should the slightest hint of higher prices come into the picture.
But let’s talk about those higher prices for a moment: This is where things get interesting and, potentially complex. What has historically ran-up the price of oil? Conflict in the Middle East: As tensions flare, oil prices jump, or at least that is what has traditionally happened. And this is likely something that hasn’t changed as a result of the United States becoming a net exporter of Crude.
As prices have continued falling further and further and further, we’ve begun to see geopolitical volatility from many areas that have traditionally presented significant risk to global markets, and the areas that I’m referring to right now are Russia, Iran and Syria. All are areas or situations with the potential to significantly change matters over the course of a weekend (or perhaps even overnight). As prices fall further, the economic prospects of these geographies continues to dwindle, so their motivation to act increases the more that oil prices fall.
So, by betting on further long-term declines in oil prices, it appears as though one would also be placing a synchronous bet on a continued lack of significant increase in conflict in the Middle East. And more to the point – it only presents an ‘almost’ 1-to-1 risk-to-reward ratio, so you won’t even be paid handsomely to make that bet. Probabilistically speaking, this play would actually cost you considering the negative risk-reward potential, as faulty risk-reward is the Number One Mistake that Many Forex Traders Make.
Never Buy on Hope
Does that mean that we should just rush out and buy oil and hope that the Middle East sees an increase in conflict? No, definitely not. It flies in the face of risk management principles to just ‘buy and hope.' Rather, we can draw back to price action to see when that short-squeeze may come in. Now, if this is driven by a pickup in geopolitical tensions, you’re probably going to miss the top-side breakout, and that’s ok. If something like this happens, we’ll likely see a gap-like move higher in oil prices as the world braces for impact from whatever it is that creates the move.
Should such a ‘shock’ take place, this can potentially reverse the trajectory of oil prices and might even lead to a new up-trend. Particularly if that shock has anything to do with a lessening of supply which is somewhat normal when we see increased violence or war in a region. Again, we’re not telling you to expect this to happen, this is simply a possibility and one that we surely hope doesn’t develop. But as a trader you have to look at the world realistically and the point of the matter is that there is a significantly more attractive risk-reward ratio on the top-side of oil prices, especially if there is some motivation for those prices to move higher.
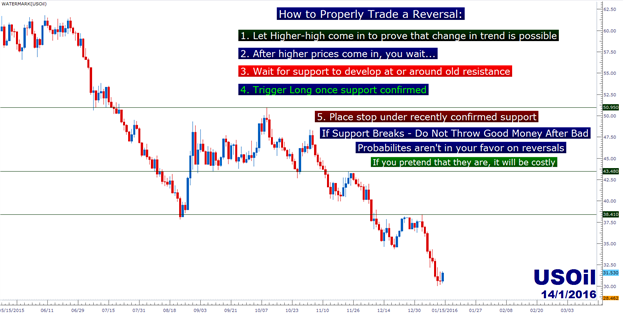
To trade this theme, traders can enact a two-part strategy in an effort of getting probabilities on their side as much as possible for playing a reversal. Step 1 is to wait for a ‘higher-high’ to come in to prove that bulls will, in fact, be able to push oil prices higher. Think of that new ‘higher-high’ as a type of activation switch that then tells you to begin scanning for top-side setups. And that isn’t enough to just get long, you still need to wait for the setup, and for that we can recruit price action once again.
On the chart below, we go over a mechanism that traders can use to trade the long side of oil if we do, in fact, get a reversal in the trend in the coming quarters. Notice that we’ve moved down to the daily chart in an effort to get a greater degree of granularity with oil prices. The most recent swing-high here is at $38.41, so traders can look for breaks above this level to open the possibility of a ‘bigger-picture’ reversal play.
Chart 4: Crude oil (FXCM: USOIL) Daily Chart: June 2015 to January 2016
The Direct Connection to FX Markets: The Canadian Dollar
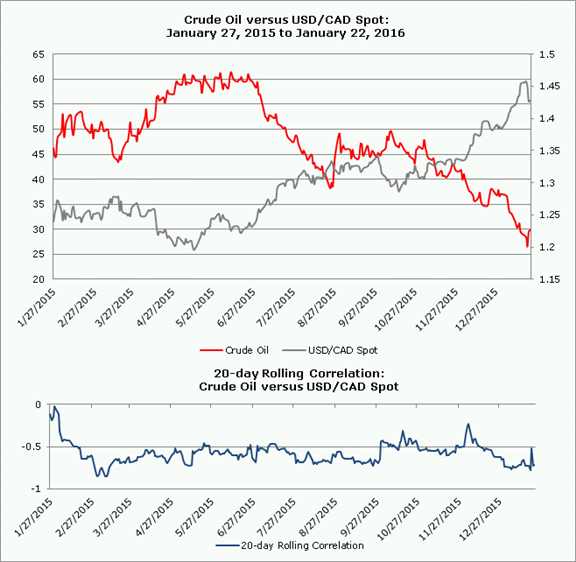
The last big question here is, “What will happen to the commodity-sensitive currencies like the Canadian Dollar?” Indeed, the Canadian Dollar has had a rough go of things recently, thanks to…oil. Over the past year, USD/CAD and Crude oil have consistently mainted statistically significant negative rolling 20-day and rolling 60-day correlations: the current 20-day correlation is -0.72; the current 60-day correlation is -0.65.
Chart 5: USD/CAD versus Crude Oil: January 27, 2015 to January 21, 2016
Fundamentally speaking, USD/CAD is perhaps the most interesting commodity currency pair. In the event that oil prices stabilize, the Canadian Dollar may already have a very significant bullish catalyst in tow: the election of Justin Trudeau as the new Canadian prime minister. Prime Minister Trudea has pledged expansive deficit spending to help stimulate the economy, which should be to the Canadian Dollar’s benefit over the long-term.
Under the Mundell-Fleming model (or the IS-LM-BoP model), exchange rates are expected to depreciate when central banks ease or fiscal spending drops, and exchange rates are expected to appreciate when central banks tighten policy or fiscal spending increases. The rationale is logical: if aggregate demand is above prior expectations, changes are good that inflation runs higher, and that central banks will need to tighten monetary policy. Essentially, expansive fiscal policy and restricted monetary policy should have the same impact over the long-term: a stronger local currency.
Now that a controversial, tight-pursed Conservative government is being swept from power, replaced by a Liberal government inclined to increase fiscal spending, we believe there is an increased probability that the Bank of Canada won't be the only institution attempting to stimulate the economy anymore (as is the case in the United States, Britain, and the Euro-Zone, where austerity – wrongly – reigns supreme). The BOC said as much at their January 2016 meeting, when they disclosed that they chose to withstand another rate cut in favor of waiting for new fiscal spending measures to be announced, as the BOC has yet to factor them into their forecasts.
The writing is on the wall: if fiscal spending is going to increase, the BOC might not need to ease further to stem off the recession; a shift away from dovish rhetoric could help the Canadian Dollar regain lost ground after a horrible 2015. The narrative for the Canadian Dollar is shifting to a more optimistic tone: at this point in 2015, it was all about weaker oil prices and their impending decline, a dovish BOC, and a government that was anti-fiscal stimulus; now, if it becomes about stable oil prices, a neutralized BOC, and a government that is pro-fiscal stimulus. The overarching fundamental backdrop for the Canadian Dollar may literally be turning on its head.
Chart 6: USD/CAD Spot and Speculative Sentiment Index (SSI) (Daily): January 2013 to Present
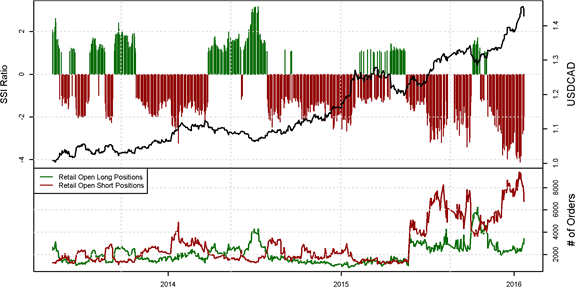
If there is going to be a sharp reversal in USD/CAD, the place to keep an eye out for it will be in retail trader positioning. Ever since mid-October 2015, the retail crowd has been net-short USD/CAD, and during this time, the pair has rallied from approximately rallied from around C$1.3000 to above C$1.4600 – over +12%. We’re keen on watching crowd positioning because the crowd has showed the tendency to take the opposite side of the prevailing trend in recent months in USD/CAD.
Accordingly, we think this will be a good warning sign for a potential top in the market: once the retail crowd flips to net-long USD/CAD, the chances of a major reversal in the Canadian Dollar – and likely, as a result, oil – increase dramatically. As always, you can follow live SSI readings on the DailyFX Sentiment page.
Join us today, January 29, 2016 at 14:00 GMT �for a special webinar on this topic.
--- Written by James Stanley, Currency Analyst and Christopher Vecchio, Currency Strategist
*This article was originally published on Friday, January 22, 2016.


