


Gold prices produced a relatively tepid reaction after the Federal Reserve finally issued its first post-QE interest rate hike at the December meeting of the rate-setting FOMC committee. Prices edged down toward 2015 lows but a big-splash breakdown was noticeably absent.
This seems to reflect the widespread expectation of the hike prior to its announcement – traders were pricing in the probability of “liftoff” at close to 80 percent weeks before the meeting – as well as seasonal considerations. Indeed, traders’ apparent unwillingness to rock the boat with just two weeks left in the calendar year made for muted responses across the asset class spectrum despite the historic significance of the Fed’s rate increase.
This sanguine disposition seems unlikely to carry forward as the calendar turns to 2016. For all the dovish rhetoric surrounding the start of the Fed’s tightening cycle, it is worth noting that policymakers maintained their outlook for next year’s policy path unchanged from September’s projection – calling for 4 rate hikes in the coming 12 months – even as they trimmed inflation bets.
For their part, the markets envision only two 25bps increases in the Fed Funds rate in 2016. This sets the stage for a surprise from Janet Yellen and company, particularly considering the notably more hawkish makeup of the FOMC this time around.
Prepared by Ilya Spivak
Whether or not the Fed actually delivers another hike in the first quarter, the broad-based pickup in participation and return of liquidity at the start of the year ought to see investors revisit December’s rate path projection and weigh probabilities for a move in March. US economic news-flow has been broadly stable since mid-2015. Meanwhile, the crude oil plunge recorded in the second half of 2014 should finally begin to re-base out of year-on-year CPI calculations, pushing headline inflation closer to the core rate (which is already at the Fed’s target of 2 percent). This may begin to fuel speculation that the central bank meant what it said and could be gearing up to tighten faster than the consensus outlook envisions.
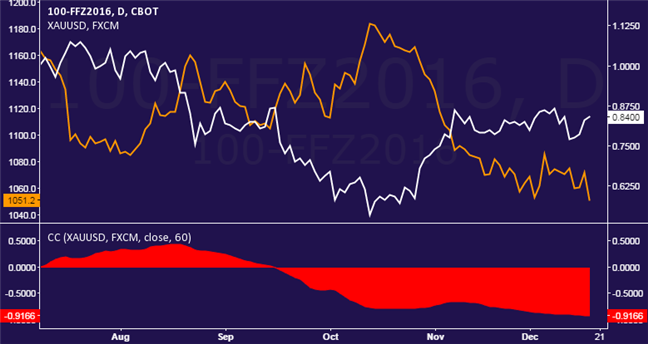
Gold prices continue to exhibit a strong relationship with Fed policy bets. Indeed, the projected 2016 policy path implied in Fed Funds futures shows an impressive -0.92 inverse correlation with spot prices for the yellow metal (on rolling 60-day studies, see chart). Needless to say, this is not surprising considering gold’s familiar appeal as an alternative store of value and go-to anti-fiat asset. If markets begin to consider the possibility that stimulus withdrawal might proceed closer in line with FOMC projections versus standing market expectations, gold prices are likely to face a swell in selling pressure.
Technical Forecast: Gold Testing Support, Bearish on a Break Below 1155
Back in September we warned of the risk for a near-term correction higher to test the 52-week moving average and indeed the following weeks saw gold prices probe & fail to break above this threshold before turning over sharply. The subsequent decline is now testing a key support zone heading into the close of the year at 1044/53. This region is defined by the 61.8% extension off the 2012 high, the 2010 low and basic parallel support extending off the 2014 lows.

Since the late-2011 record high, gold prices have tended to make the yearly high in price within the first quarter of the year. Note that an outside weekly-reversal candle took shape on the rebound off this key support with building divergence on the daily & weekly charts suggesting that the short-side remains vulnerable near-term heading into the start of the year. Interim resistance stands at the July low-week close at 1098 backed by the sliding parallel extending off the October high and the 1151/55 pivot region. A breach above this level invalidates the broader short bias with such a scenario risking a rally back towards median-line resistance near 1200. Bottom line: we’ll be looking for a push higher in early 1Q for more favorable short entries with a break of the low targeting support objectives 1005, the sliding parallel extending off the 2013 low and confluence Fibonacci support at 975/80.
View next 2016 Trading Forecast: Yen Forecast: Fed Rate Hikes and BoJ Action Points to USD/JPY Gains


