


Talking Points:
- Drawing trend lines creates potential trade entries
- SSI helps filter trading direction
- A 1:2 risk-reward ratio simplifies our exit logic
New traders are normally hungry for learning new tools and techniques. Having the drive to learn how different techniques work is great. But if we attempt to use everything we’ve learned on every trade and in every situation, it can result in crowded charts, confusion and an increased level of stress. I am a big fan of keeping things simple. It’s what I’ve seen have the most success in my own trading. So today, we take a look at an easy (yet effective) strategy that uses only trend lines and sentiment.
Creating Trend Lines
We first want to create trend lines by linking together multiple “swing highs” and “swing lows.” Swing highs and swing lows are the peaks and valleys we see on our charts. When we can draw a single line through multiple peaks or valleys, we can extend the line further out into the future in an attempt to predict where price might bounce in the future.
A current example of this can be seen on a EURUSD Weekly chart. We’ve connected two swing lows. The first was back in November 2012 and the second was in July 2013. Projecting this line out to today, the EURUSD is just underneath this major trend line. The chart below shows this in greater detail.
Learn Forex: EURUSD Weekly – Trend Line
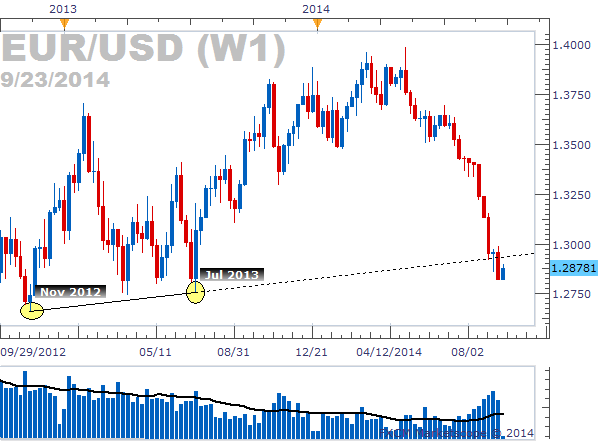
(Created using Marketscope 2.0 charting package)
Even though price has broken through this trend line, it can still be useful. Using the trading method taught in this article, we can look to sell if price approaches this trend line from below. “What once was support can later be resistance.” Price could bounce off this trend line.
Using SSI as Confirmation Filter
Each trade I place on my account is filtered using SSI. For potential buy trade setups, we want to see a negative SSI value. For potential sell trades, we want to see a positive SSI value. This will place our trades opposite of the retail trading crowd which could create a trading edge.
For the above example of the EURUSD, we would want to see SSI as a positive value to allow us to place a sell trade. As it turns out, the SSI for the EURUSD is currently +1.14. While this isn’t an extreme value, it can still justify placing a sell trade.
Learn Forex: EURUSD SSI

(Created using DailyFX Plus’ SSI)
Had the EURUSD SSI been a negative value, it would have filtered out the trend line sell trade from the chart above. We would not have placed the trade. We generally do not want to trade with the crowd, but against it. It just so happens that SSI does gives us the greenlight on this sell trade, however.
Entry and Exit Logic
Ideally, we want to enter a trend line trade when price strikes or gets near the actual trend line. The EURUSD trend line currently rests at 1.2930. So we can place an Entry order to sell at 1.2930 or slightly under. For this example, we are going to set our Entry order to sell the EURUSD at 1.2920, 10 pips below the trend line. This will increase the likelihood of being put into the trade.
If we are placed into the trade, we want to already have a stop and limit set to manage the position for us. For our stop loss, we want it to be beyond the trend line we are trading. For large time frames like a Weekly or a Daily chart, it is not uncommon to set a stop 25-100 pips above the trend line. For smaller time frame chart setups, we would set our stop less than 25 pips away. For this trade, we’ve opted for a 100 pip stop set at 1.3020. This will give our trade room to breathe and will only be stopped out on a true breakout to the upside.
Learn Forex: EURUSD Trade Management, -100 Pip Stop, +200 Pip Limit

For our profit target, we want to use a 1:2 risk-reward ratio. So if our stop loss is -100 pips, we want our profit target to be +200 pips. Using a 1:2 ratio allows us to be profitable traders as long as we have an overall win rate higher than 33%. This is one of the traits of successful traders that I teach during our Forex Fast-Track II webinar, which can be viewed here.
K.I.S.S.
There can be value in keeping things simple. In a few short minutes, we have generated a potential sell in the EURUSD based on trend lines and retail sentiment. Hopefully it will turn out a winner. But if not, our 1:2 risk-reward ratio will allow us to live to trade another day. If you would like to test these methods, download a Free Forex Demo account today with free charts and real-time pricing data.
Good trading!
---Written by Rob Pasche
To contact Rob, email rpasche@dailyfx.com.
Sign up for my email list to stay up to date with my latest articles and videos.
Start your Forex trading on the right foot with the Forex Fast-Track Webinar Series. This 4-part, live webinar course is the disciplined Traders’ Fast-Track to the Forex Market. Topics include:
- Using FXCM’s award-winning trading platform
- Calculating Leverage and reducing risk
- Trading with a simple (yet effective) trading strategy
- Maintaining for Forex account and enrolling in on-going education
This course is completely free, so sign up or watch on-demand today.


