


Talking Points:
-EURJPY - An Impressive Trend
-Long Term EURJPY Resistance
-Ichimoku Set-Up with Key Levels
From late 2012 to the 1st trading day of 2014, many traders felt the downtrend in the JPY which pushes higher JPY crosses couldn’t be stopped. A lot of the downfall in the JPY has been on the back of a major monetary policy committee. For a while, the monetary policy taken on by the Bank of Japan seemed to have all but sealed the victory of their war on inflation all the while weakening the JPY. However, 2014 hasn’t been kind to those looking for a weaker JPY and given the impending
EURJPY - An Impressive Trend
When you step back, you realize the EURJPY was the perfect long trend trade based on each country’s monetary policy standings in mid-2012. In late July, Mario Draghi of the European Central Bank stated that they would do, “whatever it takes”, which marked the low in many EURO crosses. At the same time, Shinzo Abe was running for Prime Minister in Japan, and he was promising a restoration of economic pride by raising inflation which would weaken the JPY and it did. This made EURJPY a screamer to the upside since summer 2012, but 2014 has brought of shifting of tides that could allow us to find a trading opportunity to the downside.
Learn Forex: EURJPY Has Finally Found Resistance
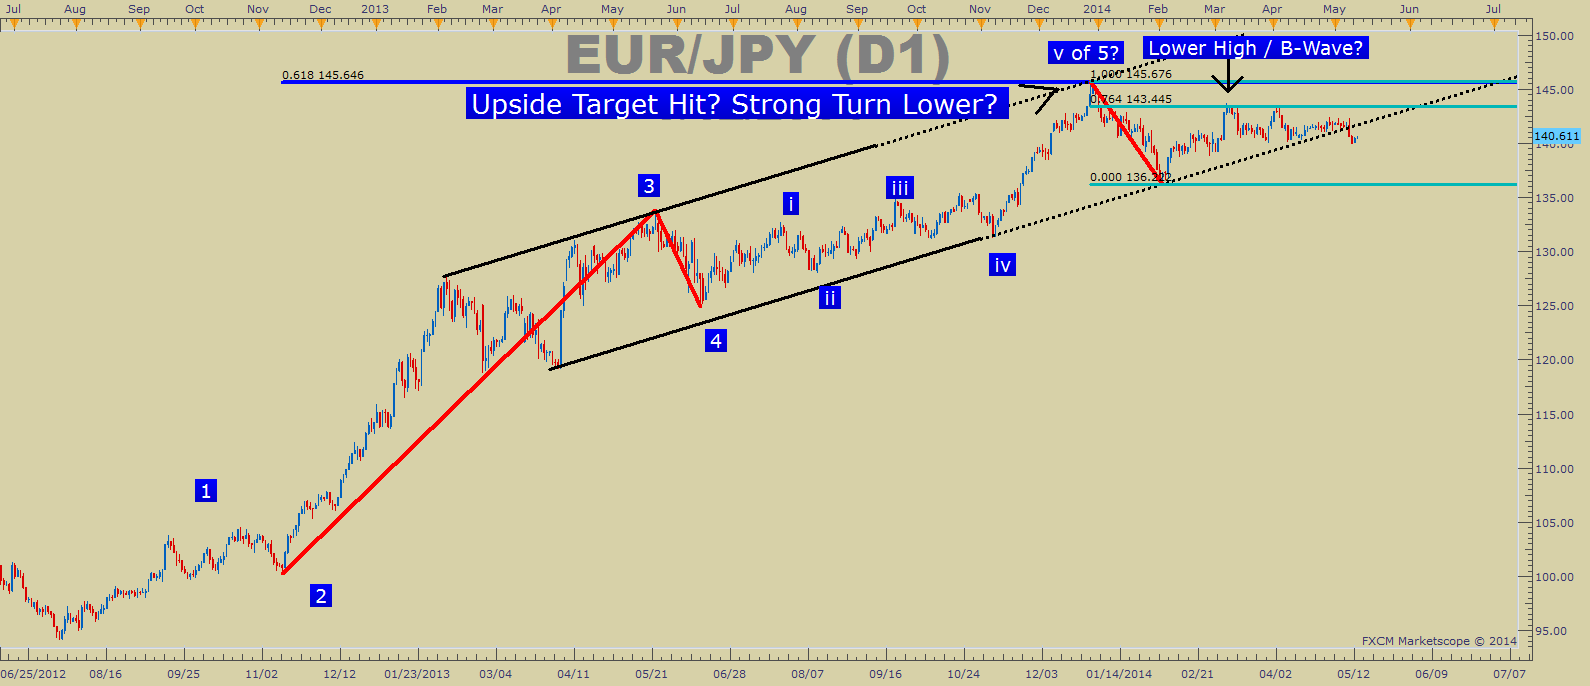
Presented by FXCM’s Marketscope Charts
The bottom left of the chart has the low put in before Draghi’s comment mentioned earlier. As Euro strength began to gather steam, so did JPY weakness. The JPY weakness ran throughout the currency world but was most cleanly seen in EURJPY, which rose 5,100+ pips from mid-2012 to the beginning of 2014. After this strong push higher, we’re going to look for a reversal or trend trading correction as per Ichimoku rules to help us enter a higher probability trade.
Long Term Resistance
If we’re looking for a trade against the trend from mid-2012, the first thing we want to see is levels and tools like oscillators that show us that EURJPY is running out of steam. We have both in looking at the Relative Strength Index & the 2009 intraday high of 139.214 which are tipping us off to the potential for a strong turn to the downside. Additionally, Elliott Wave also shows common patterns that play out before another counter leg-move. If you’re unfamiliar with Elliott Wave, here’s a quick breakdown of the tenets.
Learn Forex: 2009 High Could Soon Break As Support
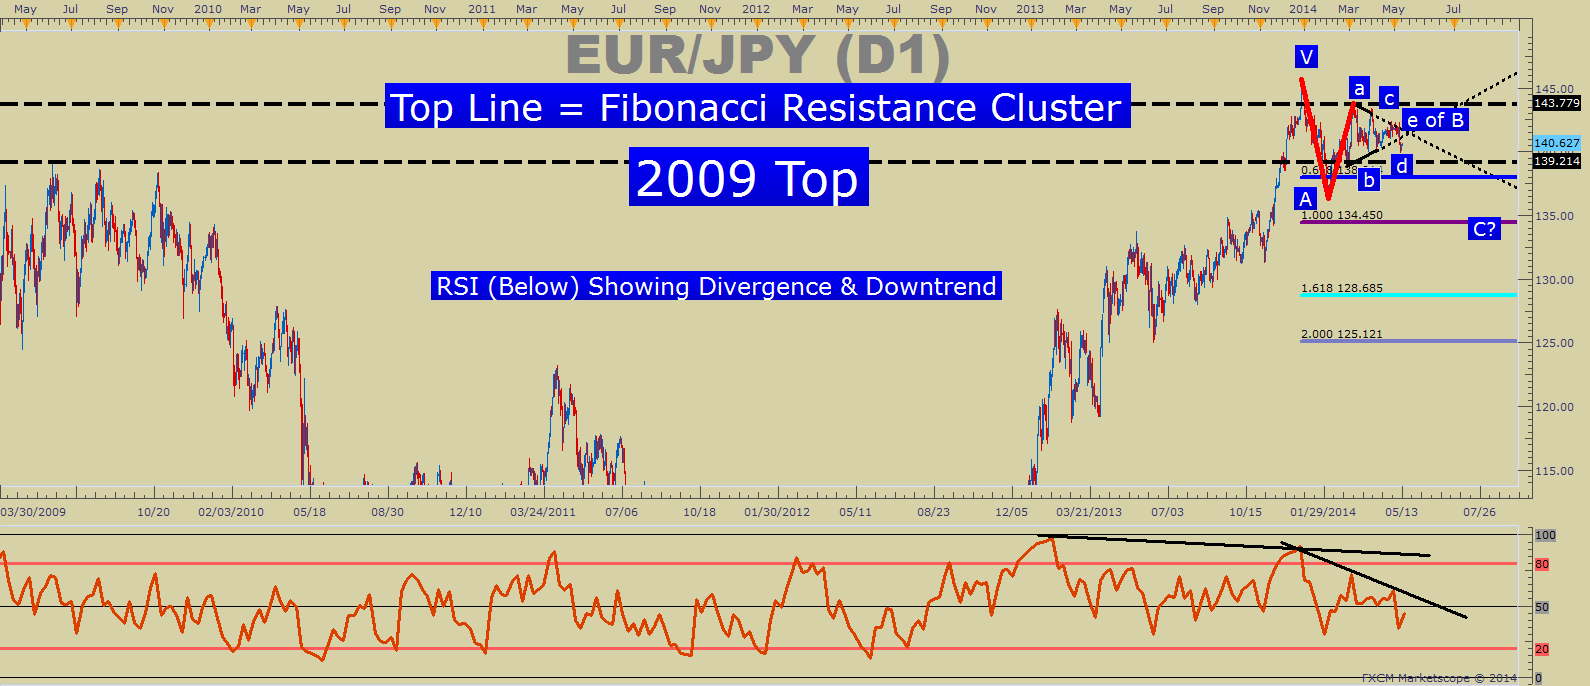
Presented by FXCM’s Marketscope Charts
Looking above, you’ll notice that the 2009 Top is under pressure and a handful of Fibonacci Resistance levels clustered around the 144 level which as acted as resistance for a majority of 2014. The RSI tool shows us a clear divergence from the May peak to the December ’13 peak so that we can look for moves lower. Lastly, before we get to Ichimoku for triggers, you can see from the top chart that a trendline dating back to February 2013 and the October ’13 low broke last week, which further shows us weakening of the uptrend. Now, let’s look at Ichimoku.
Ichimoku Set-Up with Key Levels
Last week, the European Central Bank said that they were comfortable with the idea of cutting rates in June in order to ease the pressure of low inflation on the economy. This week, ECB member, Vitor Constancio said that he estimated the high levels on the EUR have likely been the reason for 0.5% drop in inflation in recent months. As the ECB began to express distaste for a higher Euro, many traders began to sell aggressively and that brings about an opportunity on EURJPY.
Learn Forex: A Lagging Line Bearish Break Would Trigger a EURJPY Short

Presented by FXCM’s Marketscope Charts
Ichimoku Trade: Sell EURJPY on a Close & Lagging Line below Daily Cloud @ 140.00
Stop: 142.50 (Above Exhaustion Point of Triangle and 2014 Trendline)
1st Limit: 136.65 (Just above 2014 Low & 61.8% Expansion of A Wave from End of Triangle)
2nd Limit: 133.05 (Equal Wave Target whereas C=A)
If this is your first reading of the Ichimoku report, here is a recap of the traditional rules for a sell trade:
-Price is below the Kumo Cloud
-The trigger line (black) is below the base line (light blue) or is crossing below
-Lagging line is below price action from 26 periods ago (we also received confirmation on cloud bounce)
-Kumo ahead of price is bearish and falling
-Entry price is not more than 300 pips away from base line as it will likely whip back to the line if we enter on an extended move.
Happy Trading!
--Written by Tyler Yell, Trading Instructor
To contact Tyler, email instructor@dailyfx.com.
Tyler is available on Twitter @ForexYell
To be added to Tyler’s e-mail distribution list, please click here.
Add me to your Google+ Forex Circle
Become a Smarter Trader Today
Learn How To Read Price Action Signals As They Develop. This free lesson will show you the power of price action as displayed in candlesticks. The power of this tool has been used for decades and we’re all too happy to introduce it to you at no cost in order to assist your trading.


