


Talking Points:
- USDCHF has rallied 170 pips before Janet Yellen, the FOMC Fed chair announced a hike in interest rates coming next spring.
- However, worse than expected US Flash Manufacturing PMI drove USDCHF down 78 pips.
- USDCHF decline is capped at a key Fibonacci level with CCI in the oversold region signaling a bounce possible.
Never catch a falling knife” is a favorite saying shared among traders. It is a warning to traders to avoid buying a downtrend in an attempt to pick the bottom. Catching a “falling knife” both literally and figuratively can be both hazardous to your safety and to your trading account. How can traders get an edge?
Forex traders use Fibonacci retracement levels as a “catcher’s glove” that can give added confidence that a reversal is nearby. As price corrects down from making a high, traders are positioning themselves to “buy the dip”. In fact once a high is in place, traders are placing Fibonacci retracement lines on the chart in order to find their next trade hours in advance. With Fibonacci, traders can sit back and wait for price to come to their level.
Learn Forex: USDCHF Decline to Fibonacci Support
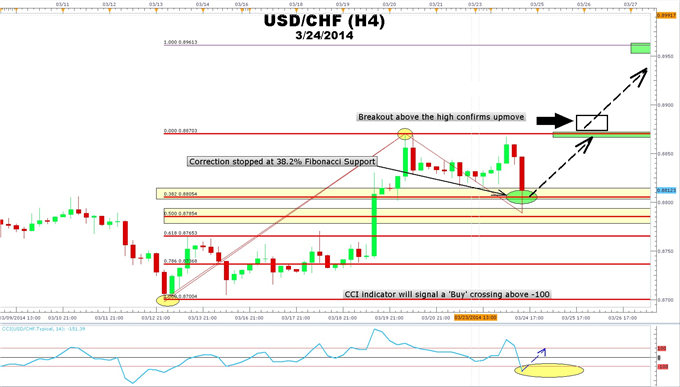
Created Using Marketscope 2.0
In the chart above, we can see how on USDCHF rallied from a low of 0.8700 on 3/13 to a high in the area of 0.8870. The fading effects of a hawkish FOMC and weaker US PMI drove USDCHF sharply lower. However, the decline was halted by the 38.2% and 50% Fibonacci levels. The quick snap-back recovery of USDCHF above the 0.8800 handle was a signal that buyers were ready to take the pair higher.
The addition of the Commodity Channel Indicator, CCI showed that USDCHF was oversold. However, a buy signal only generated when the indicator moved above the -100 horizontal reference line. Forex traders would have been ready for hours in anticipation of what would unfold next.
The Trade
Learn Forex: USDCHF Rally from 38.2% Fibonacci Level
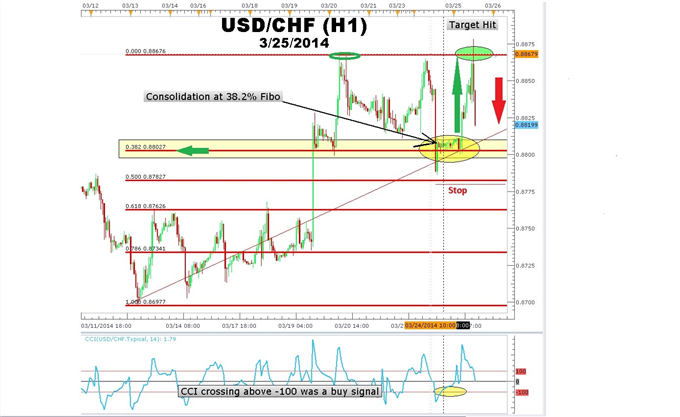
Created with Marketscope 2.0
In the chart above we can see how the trading plan played out as price consolidated for fourteen hours at the 38.2% Fibonacci level before launching to the first target at 0.8867. A buy signal was generated by CCI several candles before the actual move higher.
Money management is an important aspect of all trades including Fibonacci. Typically a protective stop is placed a few pips below the next Fibonacci level. Also, a limit is placed at or near the previous high. The limit was more than twice the stop. In some instances, price can breakout out to new highs. However, USDCHF was soundly rejected at the old high.
In sum, traders do not have to fear trading pullbacks of trends. They can gain more confidence and precision by incorporating Fibonacci retracements and CCI.
Written by Gregory McLeod Trading Instructor
This article showed you how to use Fibonacci to the bounce in USDCHF. I want to invite you to enroll in our free Fibonacci Retracement Course to further your understanding of Fibonacci. Sign our Guestbook to gain access to this course. You will automatically have universal access to other courses.
Watch Greg McLeod at 9:30 ET in the DailyFX+ Live Classroom


