


Talking Points
- The AUDNZD was one of 2013s strongest downtrends.
- Trend traders can use breakouts to time entries into the New Year.
- Donchian Channels can be used to help better identify breakout entries.
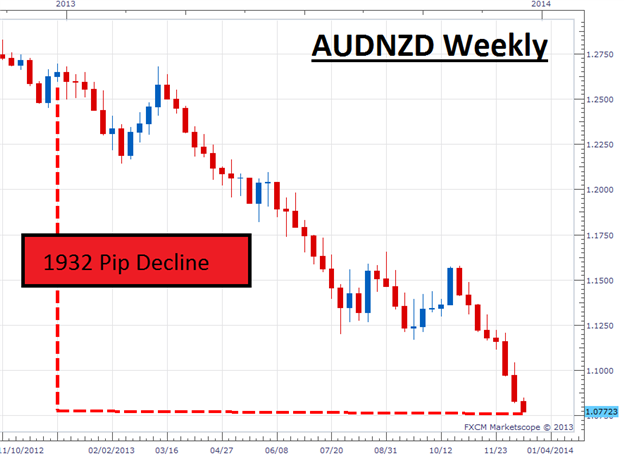
When beginning trading for a new year, it is always important to evaluate the markets long standing trends. This way we can better gauge which pairs we may want to trade into the upcoming 2014 trading year. One chart that stands out is the AUDNZD weekly chart below.
From the last week of the 2012 trading year, through the low created on December 17th the pair has declined as much as 1932 pips. As the pair continues to steadily create lower lows, this can create many opportunities for traders to sell the market.
Let’s look at one approach we can use for trading the AUDNZD in the New Year.
Breakout Entries
One way to trade a strong daily trend, is through the use of breakouts. Since the definition of a downtrend is the creation of lower lows, it is intuitive to sell the market when the market breaks a line of support to form yet other new lows. While this strategy may seem simple at first, some traders may have difficulties pinpointing where to enter the market. One way to simplify this process of identifying a new low is through the use of a technical indicator.
The Donchian Channel indicator is a custom indicator offered through the FXCM App store for Marketscope 2.0. This indicator is designed to specifically pinpoint where the market makes a new low or high. Looking at the indicator now applied on the AUDNZD daily chart below, past highs and lows can now easily be identified. Using a default setting of 20, breakout traders can then plan to enter the market each time the market creates a new 20 day low! To do this, an entry can be set below the previous low. That way in the event of a market breakout, traders will have their order triggered into the market.

There are risks associated with any market strategy and it is important to consider risk management when breakout trading. One easy way to identify stop placement is to again use the Donchian Channels. In the event that the market creates a higher high, traders selling the AUDNZD will look to exit any existing short positions.
---Written by Walker England, Trading Instructor
To contact Walker, email instructor@dailyfx.com. Follow me on Twitter at @WEnglandFX.
To be added to Walker’s e-mail distribution list, CLICK HERE and enter in your email information.
New to the FX market?Save hours in figuring out what FOREX trading is all about.
Take this free 20 minute “New to FX” course presented by DailyFX Education. In the course, you will learn about the basics of a FOREX transaction, what leverage is, and how to determine an appropriate amount of leverage for your trading.
Register HERE to start your FOREX learning now!


