


Talking Points
- JPY Crosses Are Breaking Higher
- Looking To Recent & Multi-Year Highs As Price Targets
- Looking To Pivot Levels As Resistance For Shorter Term Trading
JPY Crosses Are Breaking Higher
Trend traders are often stuck in uncomfortable territory. When they’re riding the best trends they’re often most uncomfortable with their trading. This is because they are riding the front cart of a fast moving train into new territory and they’re never sure where it will stop.
Learn Forex: Japanese Yen Crosses are Breaking Higher across the Board
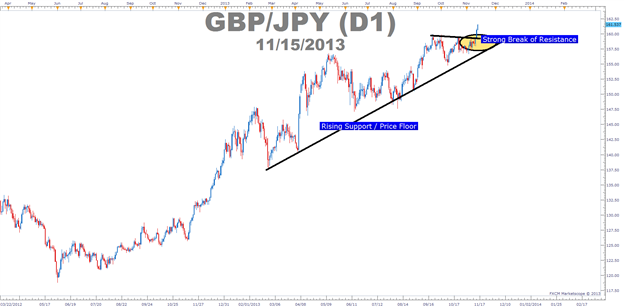
Presented by FXCM’s Marketscope Charts
This is currently happening on JPY crosses as the next leg of JPY weakness appears to be underway. JPY weakness is causing pairs like USDJPY, GBPJPY, EURJPY and others to move higher. The backdrop of this move is that all forms of the Japanese government are working under a monetary policy that is set to put Japanese exports back on the main stage of the global economy and a weak JPY is a ticket to that stage.
Looking to recent & multi-year highs as price targets
If you’re trading a currency pair that is moving higher, then we hope you’re trading with the trend as that is the preferred approach that many of us take. If that new found uptrend is below the annual high but is approaching that level, then that is the next level to target. In addition to that point, from a technical trading point of view, if there are price peaks that are below the annual high, then you would target those prices as a testament of current trend strength. Naturally, if the price of the pair your trading blows through those prior price peaks on the way to the annual high then you’re in a very strong trend and it may be a good time to tighten stops.
Learn Forex: USDJPY is targeting prior peaks as the 2013 high of 103.72 looms
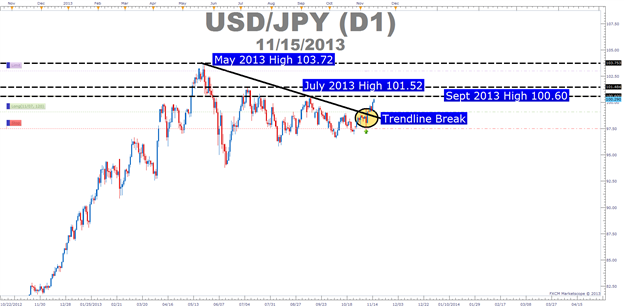
Presented by FXCM’s Marketscope Charts
Looking above, you can see that the USDJPY has broken the trendline resistance which means that underlying strength is building. Now that the chart is showing strength, we can look to prior highs of 2013 as price targets. In September, the high of USDJPY was 100.60 so that would be the near term target. However, it is up to you if price reaches that target if you want to get out at a hopeful profit or stay in the trade to see if price makes its way to the July high of 101.52.
Either way, you can use prior highs of the trading year as trading targets when trading trends. However, what do you do if you’re at the price high for the year? While this can be uncomfortable because price feels too high or overbought, there are still targets you can look to in past years to get a sense of a trend target.
Learn Forex: GBPJPY Is Trading At 2013 Highs So Look To 2009 Highs as Targets
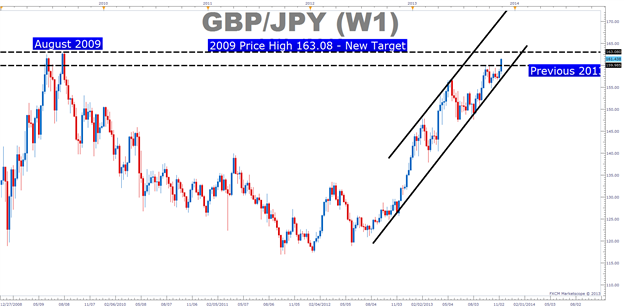
Presented by FXCM’s Marketscope Charts
Looking above, you’ll notice a longer term chart of the mighty GBPJPY which has taken out the 2013 highs. For traders who are riding this trend to the upside, you can look to prior annual highs as a targets. In August 2009, GBPJPY peaked at 163.08 before turning over. Similar to the USDJPY example above, we can use that level as a target for the current trend. If price falls short of that move and starts to move lower then we have a clue that the current trend is losing steam. If GBPJPY takes out the 2009 high then you can use that as an opportunity to stay on the train and simply tighten your stops.
Looking To Pivot Levels as Resistance for Shorter Term Trading
The examples used earlier were longer term targets. Understandably, many traders aren’t comfortable holding a trade that long and would rather look for shorter term and closer targets. In that scenario, it’s hard to find a more objective and easier tool to use than Pivot Points.
Learn Forex: Pivots Can Also Be Helpful for Short-Term Targets beyond Highs
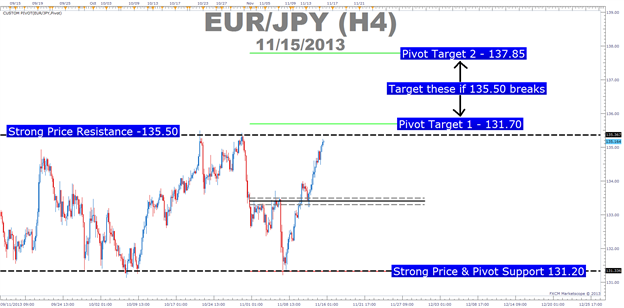
Presented by FXCM’s Marketscope Charts
The benefits of Pivot Points are many but among my favorite is their objectivity. If an uptrend is picking up steam then you’ll likely see resistance points taken out. In a strong downtrend, you’ll likely see support pivots getting hit showing weakness in the pair. Therefore, once you’ve identified the trend but would like to take a shorter term trend trading approach, you can use pivots as a helpful gauge of when to get out of a profitable trade or exit a losing trade.
Closing Thoughts
Trend trading is a great strategy but it’s not without challenge. This article walked through using previous price action highs or pivot points as targets when trading a strong trend. Your preference to either approach should depend on your time horizon for holding a trade.
Happy Trading!
---Written by Tyler Yell, Trading Instructor
To contact Tyler, email instructor@dailyfx.com.
To be added to Tyler’s e-mail distribution list, please click here.
If you’d like to combine this lesson with price action signals you can register to take this free 20 minute “Price Action” course presented by DailyFX Education. In the course, you will learn about the basics of price action and how to use the clues the market is providing to place trades.
Register HERE to start your FOREX learning now!


