


Article Summary:Trendlines are a staple for technical Forex traders that can be used on any currency pair and on any time frame. Follow these 3 easy steps to drawing trend lines which is a powerful tool to time entries and exits of a trade.
A trendline is probably the most basic tool in the technical trader’s toolbox. They are easy to understand and can be used in combination with any other tools you might already be using. By definition, a trendline is a line connecting two or more lows or two or more highs, with the lines projected out into the future. Ideally, traders look at these extended lines and trade on prices reacting around them, either trading a bounce of the trendline.
So, what can we do to make sure the trendlines that we've drawn are sound?
Tip #1 – Connect Swing Lows to Swing Lows (or Swing Highs to Swing Highs)
We want to draw a line connecting either two (or more) swing lows or two (or more) swing highs. For those unfamiliar with the term swing highs/lows, we simply mean the peaks and valleys created with zig zagging prices. Once we connect peaks with other peaks or valleys with other valleys, we want to see the line not being broken by any candle between those two points. Take the examples below.
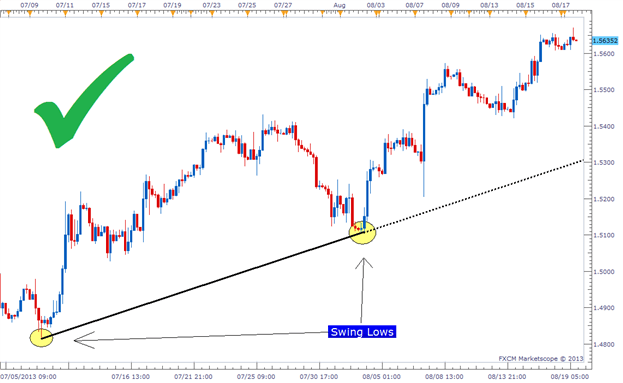
Learn Forex: Draw Unbroken Trendlines
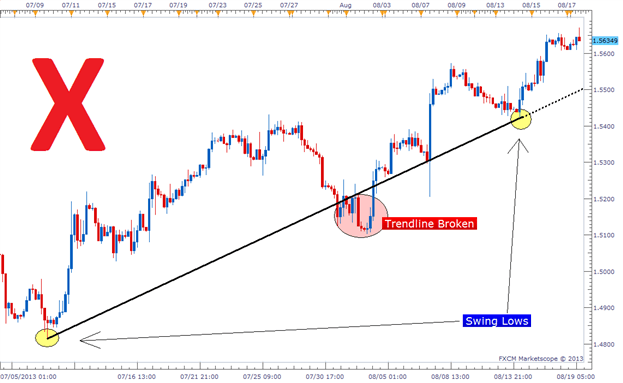
In the first image, you will find that we successfully drew a line connecting two swing lows. But, between those two points, the price broke through the line that we drew. This invalidates the trendline.
What we want is what we see in the second image, two swing lows connected together by a line unbroken by price. This is a valid trendline that is ready to be projected out into the future.
Next time price gets near this trendline, we will want to look for a bounce. A convenient way of trading this type of setup is using Entry orders. Entry orders can be set to get you into a trade at a specific price.
I like to set my Entry orders several pips above a support trendlineor several pips below a resistance trendline. That way if the price reacts before getting to the trendline, I still have a chance at getting into a trade. You have to remember that if there are many traders looking at the same price to act as support/resistance, there is a chance that orders will be stacked around these levels. If there are enough orders keeping the price from getting to the trendline, the price might not get to you order if it’s placed directly on it.
Tip #2 – The More Connecting Points, the Better
You've probably noticed that I have referenced two or more highs/lows make up a trendline. The reason I mention "or more" is because trendlines can continue to be relevant far out into the future and can be bounced off of several times. As a general rule of thumb, the more times a trendline has been hit and respected with a bounce, the more important the market believes that it is. Like anything, however, trendlines cannot last forever. So after a multitude of bounces, one has to expect a break to eventually occur.
The first reason this is true is that you can draw a line connecting any two points on a chart. Just because there were two distinct highs in the last 50 bars and you drew a line between them doesn't actually mean the line is a valid trendline. What you would have is a potential trendline.
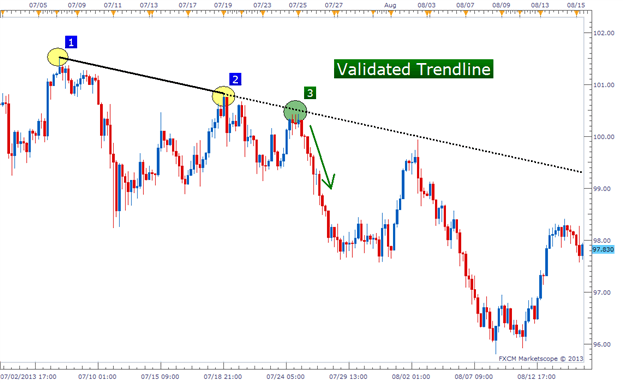
To truly validate a trendline, you need to see the price actually react from a line projected from a trendline drawn based off of two prior points. Essentially, a third high/low is needed to truly solidify a trendline. Once you have this, you can then feel better about looking for opportunities to exploit the market when price reaches the trendline again. While having a third high/low is recommended before looking for a trade, it is not required. Aiming for an entry on point #3 below could work out just fine.

Learn Forex: Validate Trendlines
Each time you see the price bounce off the same line, the more likely it is that others are watching it too and are playing the same game you are. This could help you get several good entries in a row, but remember trendlines won't last forever. So you want to make sure you set proper stop losses to get you out quickly if the support/resistance trendline eventually fails.
Tip #3 – Buy Bullish Trendlines, Sell Bearish Trendlines
The trend is your friend! This steadfast rule also applies to trading trendlines. For experienced traders, this basically means we should only look to buy at bullish support lines and sell at bearish resistance lines. For traders not into trading jargon, let the following images below explain this to you.
Learn Forex: Buying Bullish Support Trendlines
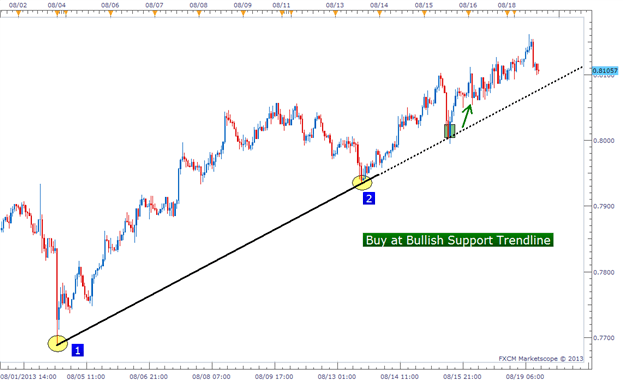
An upward slanting (bullish) trendline means the price has been trending up, so we want to look for buying opportunities. Buying opportunities occur when the price drops down and comes close to the trendline that has caused upward bounces before.
Learn Forex: Selling Bearish Resistance Trendlines
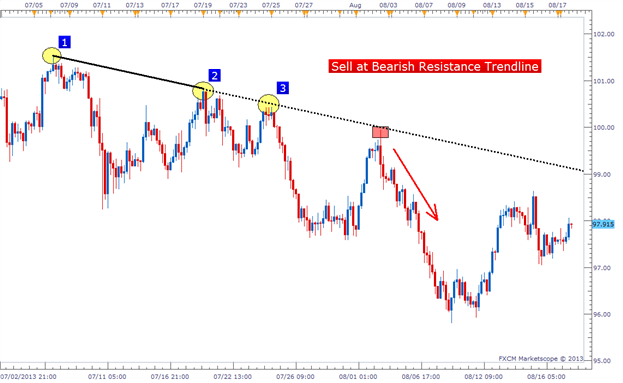
A downward slanting (bearish) trendline means the price has been trending down, so we want to look for selling opportunities. Selling opportunities occur when the price moves up and comes close to the trendline that has caused downward bounces before.
Trading only in the direction of the trend well let us exploit potential trendline bounces as efficiently as possible. And while they won't always give us winning trades, the trades that are winners should give us more pips than had we been attempting to place trades against the trend.
(Note: There is also the potential to trade a break of a trendline rather than a bounce, but that is a more advanced technique. This is something to be covered in a future article.)
Connecting the Dots
Coming full circle, trendlines are a very simple tool to use. You are connecting dots on a chart. But hopefully the three tips above will help you take drawing trendlines to the next level. Make sure that the lines you draw are connecting two or more highs or two or more lows, but have not been broken by the price between those points. Remember to look for at a 3rd bounce to validate a trendline. Also, make sure you are taking advantage of trading with the trend by looking for buys in bullish markets and sells in bearish markets.
Overall, I hope this makes you more confident in drawing trendlines. Good trading!
Identifying entries and exits are one part of trendline trading; check out our Traits of Successful Traders guide to learn the other psychological and strategic tools traders need in a trendline strategy.


