


Article Summary: Is the current GBPJPY uptrend coming to an end? Learn how to identify market direction using moving averages.
On a daily basis, traders analyze wether markets are heading higher and lower, and look for direction to trade their favorite currency pairs. One of the most commonly used indicators that can be applied for this purpose is the simple moving average (MVA). Traders can apply a series of averages and interpret their results to see if its an opportune time to trade.
Lets take a look at some of the most used averages and how to interpret them to find market direction and momentum.
Learn Forex –GBPJPY Trend with Moving Averages
Interpreting Moving Averages
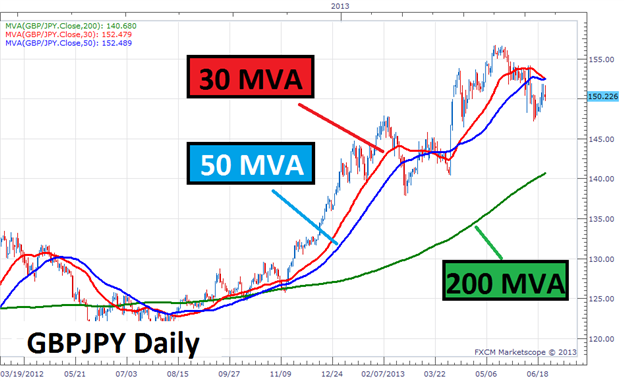
The graph above shows some of the most commonly used Moving Averages in Forex. This includes the 30 (Red), 50 (Blue) and 200 (Green). To calculate these averages, the charting platform adds all of the closing prices for the designated amount of periods, then devides that value to find where the indicator will reside on the graph. From this point, finding a market trend is all in the interpretation of these averages.
Since there are three avereages with different values, they will updated at varying speeds. Being the shortest, the 30 MVA will be the quickest to react to price action changes. This is contrary to the 200 MVA which is the slowest to update. Normally traders will wait for the quicker moving indicators to either move above or below the slower avereages to establish a trend. If all averages are pointing higher, this would be interpreted as a strong uptrend and traders would look to buy that specific pair. In the event that all moving averages are heading lower, this would be interpreted as a downtrend and traders would look to sell the market.
Learn Forex –EURUSD Basic Breakout Strategy

(Created using FXCM’s Marketscope 2.0 charts)
When Not To Trade
Now that we know how to read MVAs let’s see how they apply to the GBPJPY. First it is important to notice that that both the 30 and 50 MVA reside above the 200 MVA. This is indicative of an uptrend and as long as momentum is heading higher, traders should look to take fresh buying positions. However, upon closer inspection, the 30 period MVA is moving below the 50 for the second time in the 2013 trading year.
This signal can be our first hint that uptrend momentum is waning. Even though the trend is still up, momentum in the short run is heading lower. Trend traders should wait patiently for the 30 period MVA to return back above the 50 to avoid a potential change in the trend. When all moving MVAs are back pointing in the same direction, new trades can then be initiated.
---Written by Walker England, Trading Instructor
To contact Walker, email instructor@dailyfx.com. Follow me on Twitter at @WEnglandFX.
To be added to Walker’s e-mail distribution list, CLICK HERE and enter in your email information
Want to learn more about Moving Averages?
Sign up for this free 20 minute course presented by the DailyFX Education team.
Register HERE to start your FOREX learning now!


