


Article Summary: Over the past few weeks, you’ve been introduced to different aspects of the very diverse Ichimoku Trading System. Ichimoku is a trend following system with specific entry points as well as exits incase the trend decides to change course. This article will provide a method for exiting the trades that are profitable with distinct exits in the direction of the trend while minimizing risk.
Markets are still recovering from a wild week led by Italy’s election that showed a huge wave of no confidence in the current government to restore financial integrity to the country’s economy. The result was three parties who refuse to work together each receiving near 30% of the vote in a parliamentary type government. The reason the Italian election is of paramount importance is that Italy is the most indebted country in the Eurozone behind Greece and houses the third largest bond market in the world behind Japan and the United States.
Last week, we looked beyond the Eurozone for trade opportunities with Ichimoku until Italy is ironed out and we’ll keep that mindset this week. The reason for this current “Euro-Avoidance” is that EU leaders are denying a Currency War (online course free after free registration) and if Greece was any indication of how the powers that be are going to react to Italy’s election then they will continue to require new elections until a pro-bailout and austerity party is elected. This will cause high volatility with no clear direction on the pair which is often not in an individual trader’s best interest.
Strategy for Exiting Profitable Trades with Ichimoku
Every Thursday, DailyFX Plus allows me to take an hour and work with our traders in a live format to walk through Ichimoku and discuss current trade set ups among different time frames. If you have an interest in joining one of these sessions, you’re welcome to send me an email and I’ll present you with a temporary log in. However, a question that is never left out is regarding targeting exit points with the trend and that is the top of discussion for today.
In short, you’re going to be introduced to the concept of using Pivot levels to target profitable exit points once you’ve entered the trade. However, the idea here is to find the strategy that works best for you and many traders want to make sure they grab as much of the trend as possible. Because of that you’ll be introduced to an optional multi-exit or scaling out method.
Learn Forex: Pivot Support & Resistance Can Be Used To Target Exits
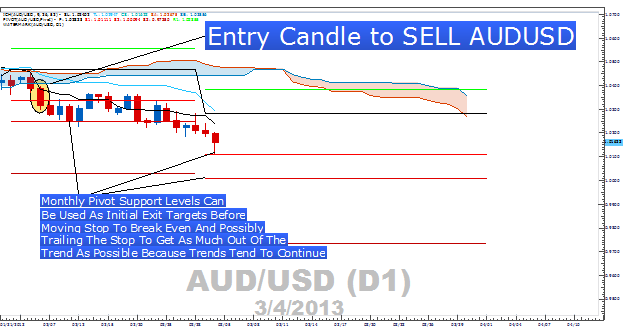
A Brief Primer on Pivots
Pivot Points or Pivot Price is a calculated price based on the high, low, and close of a prior session. The Pivot number is the high, low, and close added up and then divided by three (P= (H+L+C)/3= pivot point) and support and resistance is based on variants of these three numbers that we’ll use to target exits in the direction of the trend. This is easier than it sounds because it will be a default indicator you can add.
Learn Forex: Pivot Points Can Be Added to Your Charting Package
Once the Pivot Levels are added along with Ichimoku, we will look for price action to move to one of these levels in the direction of the trend. That is when we can exit out of a portion of our position if we wish to and move our stop to break even. Other traders may prefer to simply use a trailing stop so they squeeze as much juice out of the trend as possible.
Regarding which Pivot to use, Classic is the most used and therefore usually more reliable. For those trading on the Daily candle charts, a monthly Pivot often works best and is what you see on my chart. For those on a 4 hr or 1hr Chart, a Weekly Pivot would work well.
Ichimoku Weekly Trade: Sell USDNZD Off Of Cloud Break to the Downside
Stop: 0.8330 (near top of cloud which is major point of resistance)
Limit: 0.8025 (as of current price, this target is roughly 2 times our risk and is in the trend’s path)

If this is your first reading of the Ichimoku report, here is a recap of the Ichimoku rules for a sell trade:
-Price is below the Kumo Cloud showing a downtrend
-The trigger line (black line on my chart) is below the base line (baby blue line) or has crossed below
- Lagging line is below price action from 26 periods ago
-Future cloud ahead of price is bearish and falling (displayed as an orange cloud). This looks to be developing on NZDUSD.
When utilizing Ichimoku to spot good entries in the direction of the trend, the lagging line breaking through the cloud is a powerful confirmation for the trend entry as we see with NZDUSD. The reason for the stop placement is that the clear trend would be nullified if price broke through the cloud showing us that the trend is over. This is why you can set your exit with the cloud and look to ride the trade to a profit target in the trend's path.
Happy Trading!
---Written by Tyler Yell, Trading Instructor
To be added to Tyler’s e-mail distribution list, please click here.
Unsure which indicators match up with your skill set?
Take our Forex Trader IQ Course to receive a custom learning path for how to trade FX.


