


The Trading Opportunity
Entry : Sell in the 1.4730 – 1.4765 resistance zone after the ECB rate announcement on Thursday
Stop Loss : 1.4955 (just above the May 4 swing high)
Take Profit : 1.4100 (move the stop to break even if price makes it to 1.4600)
The Story
The fiscal challenges faced with the southern European nations continue to mount. This has created some volatile swings on the single currency in the past 45 days as the EURUSD has traded in a 1,000 pip range.
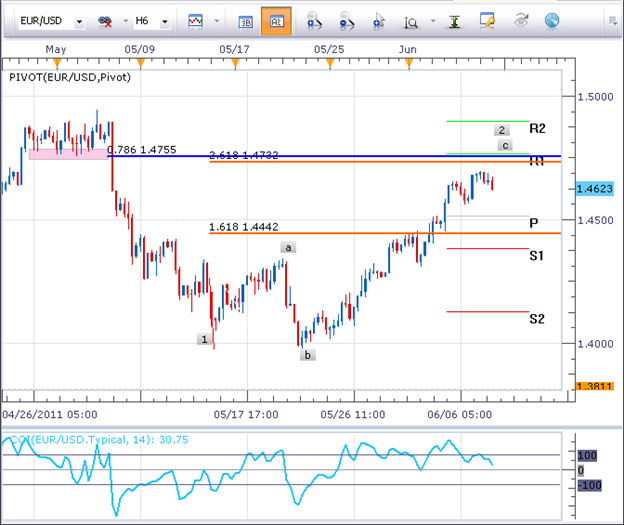
(Created using FXCM’s Marketscope 2.0 charts)
This type of price action may confuse a trader who is trying to follow the trend. The EURUSD is approaching a zone with 4 different resistance areas lining together. Additionally, our CCI indicator is flashing bearish divergence. Here is an opportunity where we can use this resistance zone to help repel prices and provide us with a good chance at a good risk to reward ratio.
The Set Up
There are 4 pieces of evidence for a 1.4730 – 1.4765 resistance zone on the EURUSD. A confluence of 2 different resistance areas generally provides a good entry with a good risk to reward ratio. This trade is showing 4 resistance areas coming together. This does NOT mean the trade will work out. The market does not have to do anything. However, as a trader, I want to find those areas on a chart where I have a good chance at a good risk to reward ratio. Then, risk a small portion of your account so that if we are wrong, we still have 98-99% of the capital remaining in our account.
- The 78.6% retracement of the down move is near 1.4755
- The 2.618 extension of the proposed wave A is near 1.4732
- Support shelf from April 28 to May 4 is near 1.4760 (since pink box above). Former support when broken can act like new resistance in the future
- Our weekly R1pivot level rests near 1.4765
CCI is flashing a bearish failure swing and bearish divergence. This means CCI has created a lower high and lower low while the price continued to move higher. Any move to the upside is likely to find resistance in the above zone. 15-30 minutes after the announcement of the ECB rate decision on Thursday, look to sell in the zone cited above. If prices do not move into the resistance zone, we’ll look to identify breakout opportunities going short in the coming days.
Jeremy Wagner contributes to the Instructor Trading Tips articles.
http://www.dailyfx.com/how_to_trade_forex/course_trading_tips
To receive more timely notifications on his reports, email instructor@dailyfx.com to be added to his distribution list.


